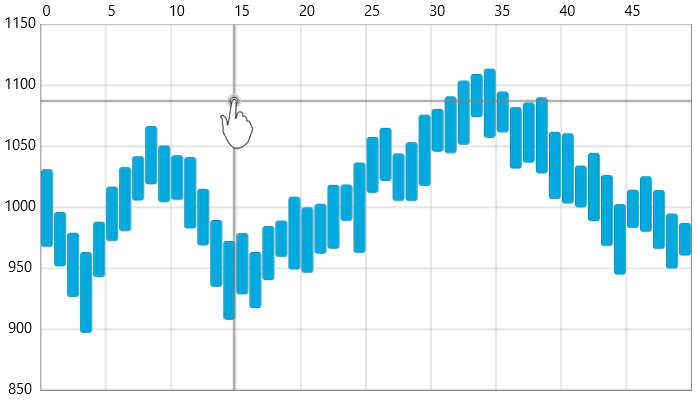
This topic explains, with code examples, how to enable and customize the crosshair in the XamDataChart™ control.
In the XamDataChart control, the crosshair is a set of two perpendicular (vertical and horizontal) lines used to locate with precision a particular point on the chart. The crosshair is helpful when identifying the relationship between some points on the graph that are aligned on or near the same axis values. The lines of the crosshair intersect at the position that corresponds to the horizontal (x-axis) or vertical (y-axis) location of the mouse cursor .

Figure 1: The XamDataChart control with a custom style for crosshair lines
The XamDataChart crosshair is hidden by default, To make it visible, set the CrosshairVisibility property of the XamDataChart control; this will make the crosshair appear when the user must hovers the mouse cursor over "] the chart plot area.
The following code snippet demonstrates how to enable crosshairs in the XamDataChart control.
In XAML:
<ig:XamDataChart x:Name="Chart" CrosshairVisibility="Visible" />
In C#:
var chart = new XamDataChart();
chart.CrosshairVisibility = Visibility.Visible;
In Visual Basic:
Dim chart As New XamDataChart()
chart.CrosshairVisibility = Visibility.Visible
Crosshairs can be customized in the following aspects:
line style
line color
line thickness
These aspects are managed through the set of properties explained in Table 1.
Table 1: Crosshair Customization Properties.
The following code snippet demonstrates how to enable and configure a crosshair that has regular straight red lines, 5 pixels thick:
In XAML:
<ig:XamDataChart x:Name="DataChart"
                 CrosshairVisibility="Visible" >
            <ig:XamDataChart.CrosshairLineStyle>
                <Style TargetType="Line">
                    <Setter Property="Stroke" Value="Gray" />
                    <Setter Property="StrokeThickness" Value="1.5" />
                </Style>
            </ig:XamDataChart.CrosshairLineStyle>
</ig:XamDataChart>