<ig:XamFinancialChart
    XAxisTickLength = "7"
    XAxisTickStrokeThickness = "5"
    XAxisTickStroke = "Blue" />
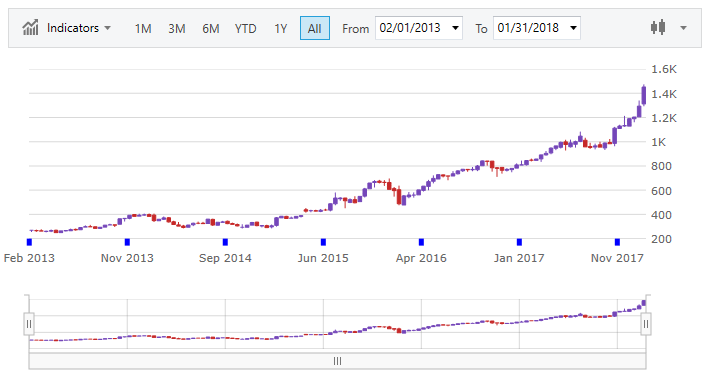
Tick marks display points on the axes. They represent a certain numeric point on a scale or the value of the underlying data item in a category axis.
This topic contains the following sections:
In the XamFinancialChart control, you can change the length, thickness, and color of the x-axis and y-axis tickmarks using the following properties:
The following code snippet demonstrates how to set the color, length and thickness of the tickmarks on the x-axis.
In XAML:
<ig:XamFinancialChart
XAxisTickLength = "7"
XAxisTickStrokeThickness = "5"
XAxisTickStroke = "Blue" />In C#:
var chart = new XamFinancialChart();
chart.XAxisTickLength = 7;
chart.XAxisTickStrokeThickness = 5;
chart.XAxisTickStroke = Brushes.Blue;

layoutRoot.Children.Add(chart);
In Visual Basic
Dim chart = New XamFinancialChart()
chart.XAxisTickLength = 7
chart.XAxisTickStrokeThickness = 5
chart.XAxisTickStroke = Brushes.Blue

layoutRoot.Children.Add(chart)