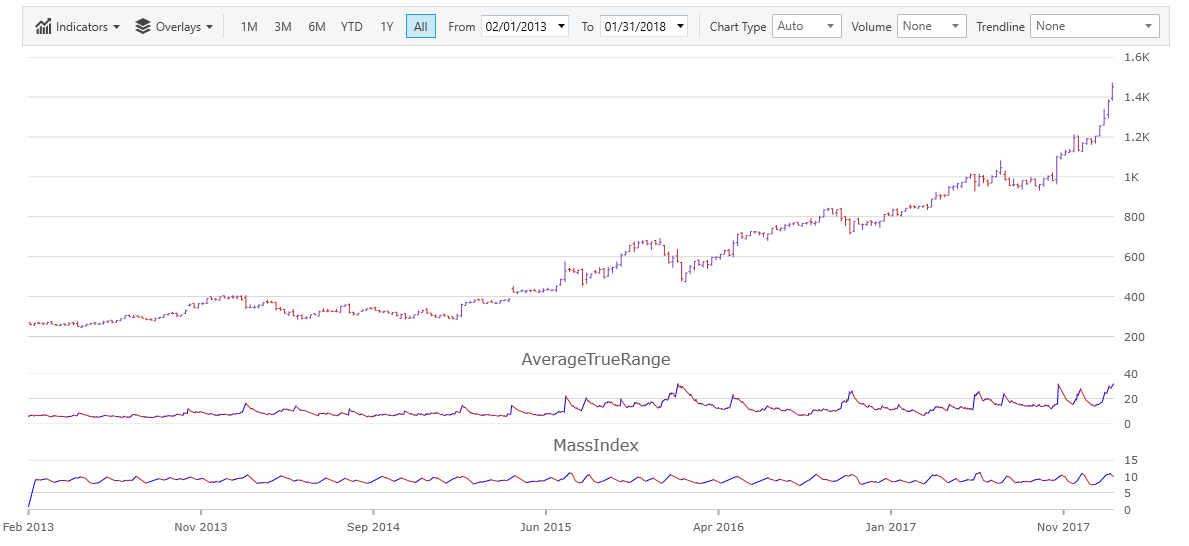

This topic demonstrates the Indicator Panes of the XamFinancialChart control.
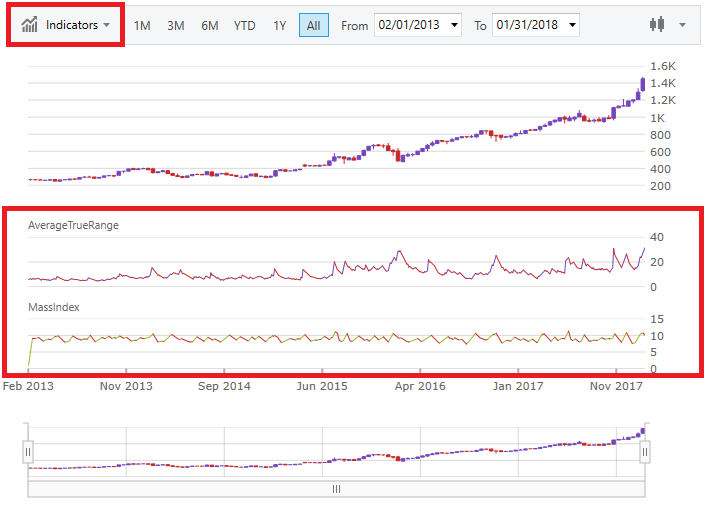
The below screenshot highlights the Indicator Panes of the chart and the drop down that is used to adjust the chart type at run time.
By default the Indicator Panes are not displayed. You can set the indicator types through code as follows:
In XAML:
<ig:XamFinancialChart>
    <ig:XamFinancialChart.IndicatorTypes>
        <ig:FinancialIndicatorTypeCollection>
            <ig:FinancialIndicatorType>AverageTrueRange</ig:FinancialIndicatorType>
            <ig:FinancialIndicatorType>MassIndex</ig:FinancialIndicatorType>
        </ig:FinancialIndicatorTypeCollection>
    </ig:XamFinancialChart.IndicatorTypes>
    <ig:XamFinancialChart.IndicatorDisplayTypes>
        <ig:IndicatorDisplayTypeCollection>
            <ig:IndicatorDisplayType>Area</ig:IndicatorDisplayType>
            <ig:IndicatorDisplayType>Column</ig:IndicatorDisplayType>
        </ig:IndicatorDisplayTypeCollection>
    </ig:XamFinancialChart.IndicatorDisplayTypes>
</ig:XamFinancialChart>
In Visual Basic:
Dim chart as New XamFinancialChart()
chart.IndicatorTypes = new FinancialIndicatorTypeCollection()
chart.IndicatorTypes.Add(Infragistics.Controls.Charts.FinancialIndicatorType.AverageTrueRange)
chart.IndicatorTypes.Add(Infragistics.Controls.Charts.FinancialIndicatorType.MassIndex)

chart.IndicatorDisplayTypes = new IndicatorDisplayTypeCollection()
chart.IndicatorDisplayTypes.Add(Infragistics.Controls.Charts.IndicatorDisplayType.Area)
chart.IndicatorDisplayTypes.Add(Infragistics.Controls.Charts.IndicatorDisplayType.Column)
In C#:
var chart = new XamFinancialChart();
chart.IndicatorTypes = new FinancialIndicatorTypeCollection();
chart.IndicatorTypes.Add(Infragistics.Controls.Charts.FinancialIndicatorType.AverageTrueRange);
chart.IndicatorTypes.Add(Infragistics.Controls.Charts.FinancialIndicatorType.MassIndex);

chart.IndicatorDisplayTypes = new IndicatorDisplayTypeCollection();
chart.IndicatorDisplayTypes.Add(Infragistics.Controls.Charts.IndicatorDisplayType.Area);
chart.IndicatorDisplayTypes.Add(Infragistics.Controls.Charts.IndicatorDisplayType.Column);In XAML:
<ig:XamFinancialChart IndicatorTypes="Area"
    IndicatorBrushes="Blue"
    IndicatorNegativeBrushes="Red"
    IndicatorThickness="2" />
In Visual Basic:
Dim chart as New XamFinancialChart()
chart.IndicatorBrushes = New Infragistics.BrushCollection()
Dim brush = As SolidColorBrush = New SolidColorBrush()
brush.Color = Colors.Blue;
chart.IndicatorBrushes.Add(brush)

chart.IndicatorNegativeBrushes = new Infragistics.BrushCollection()
Dim brush2 = As SolidColorBrush = New SolidColorBrush()
brush2.Color = Colors.Red
chart.IndicatorNegativeBrushes.Add(brush2)

chart.IndicatorThickness = 2
In C#:
var chart = new XamFinancialChart();
chart.IndicatorBrushes = new Infragistics.BrushCollection();
SolidColorBrush brush = new SolidColorBrush();
brush.Color = Colors.Blue;
chart.IndicatorBrushes.Add(brush);

chart.IndicatorNegativeBrushes = new Infragistics.BrushCollection();
SolidColorBrush brush2 = new SolidColorBrush();
brush2.Color = Colors.Red;
chart.IndicatorNegativeBrushes.Add(brush2);

chart.IndicatorThickness = 2;