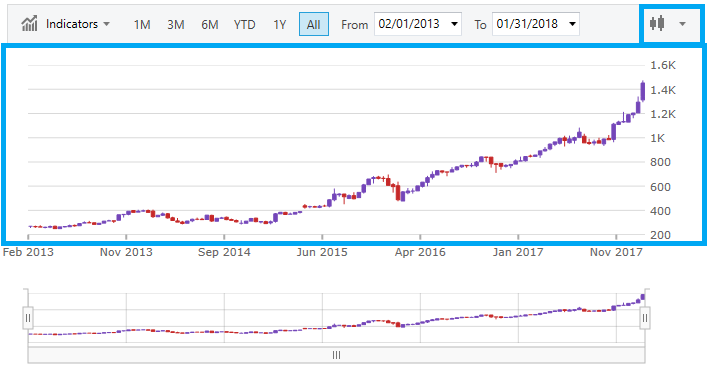

This topic demonstrates the Price Pane of the XamFinancialChart control.
The above screenshot highlights the Price Pane of the chart and the drop down that is used to adjust the chart type at run time. In addition to rendering prices the Price Pane also makes use of trendlines and financial overlays. The supported chart types for this pane are:
Auto
Bar(OHLC)
Candle
Column
Line
By default, ChartType is set to Auto, which means the chart will choose the chart type based on the data. You can set the chart type through code as follows:
In XAML:
<ig:XamFinancialChart ItemsSource="{Binding}"
    ChartType="Column"
    Brushes="Red"
    Outlines="Green"
    Thickness="2" />
In Visual Basic:
Dim chart as New XamFinancialChart()
chart.ChartType = Infragistics.Controls.Charts.FinancialChartType.Column

chart.Brushes = New Infragistics.BrushCollection()
Dim brush As SolidColorBrush = New SolidColorBrush()
brush.Color = Colors.Red;
chart.Brushes.Add(brush)

chart.Outlines = new Infragistics.BrushCollection()
Dim brush2 As SolidColorBrush = New SolidColorBrush()
brush2.Color = Colors.Green
chart.Outlines.Add(brush2)

chart.Thickness = 2
In C#:
var chart = new XamFinancialChart();
chart.ChartType = Infragistics.Controls.Charts.FinancialChartType.Column;

chart.Brushes = new Infragistics.BrushCollection();
SolidColorBrush brush = new SolidColorBrush();
brush.Color = Colors.Red;
chart.Brushes.Add(brush);

chart.Outlines = new Infragistics.BrushCollection();
SolidColorBrush brush2 = new SolidColorBrush();
brush2.Color = Colors.Green;
chart.Outlines.Add(brush2);

chart.Thickness = 2;