<ig:XamTimeline.Axis>
     <ig:DateTimeAxis AutoRange="True" />
</ig:XamTimeline.Axis>

This topic outlines the Auto-Adjust feature of the labels and tick marks on the xamTimeline™ control when zooming in on a certain section of the data.
The table below lists the required background prerequisites for this topic.
The AutoRange setting as shown here is optional. It is true by default.
In XAML:
<ig:XamTimeline.Axis>
<ig:DateTimeAxis AutoRange="True" />
</ig:XamTimeline.Axis>
The xamTimeLine control includes the capability to automatically adjust the labels and tick marks on the timeline based on the zoom level on the selected time segment of the data. For example:
When Timeline displays Year unit type:
After zooming the tick marks will display the Months.
When Timeline displays Month unit type:
After zooming the tick marks will display the Days.
When Timeline displays Day unit type:
After zooming the tick marks will display the Hours.
Following is a preview of the before and after zooming results:
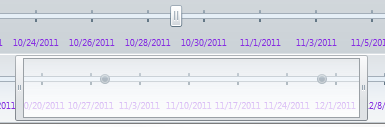
Before zooming, the control shows the days of the month labels on the timeline:
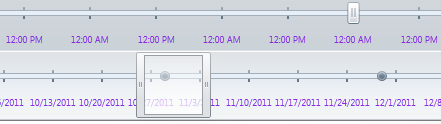
After zooming in on a few days the control Auto-Adjusts the labels to show hours:
Auto-Adjust feature can be disabled by setting the AutoRange=False on the axis of the timeline control, which requires defining the Minimum, Maximum, and Unit properties with specific range. For example:
In XAML:
<ig:XamTimeline.Axis>
   <ig:DateTimeAxis
       AutoRange=" Minimum="2011/05/01" Maximum="2012/05/01" Unit="1" />
</ig:XamTimeline.Axis>
In C#:
DateTimeAxis dt_axis = new DateTimeAxis();
dt_axis.AutoRange = false;
dt_axis.Minimum = DateTime.Parse("2012/01/01");
dt_axis.Maximum = DateTime.Parse("2012/05/01");
dt_axis.Unit = 1;
this.xamTimeLine.Axis = dt_axis;
In Visual Basic:
Dim dt_axis As New DateTimeAxis()
dt_axis.AutoRange = False
dt_axis.Minimum = DateTime.Parse("2012/01/01")
dt_axis.Maximum = DateTime.Parse("2012/05/01")
dt_axis.Unit = 1
Me.xamTimeLine.Axis = dt_axis