
This topic discusses useful information that will help you to ensure that your data is rendered properly in your treemap chart.
While the Chart control allows you to easily set the chart’s data source to your own custom data, it is important that you supply the appropriate amount and type of data that the chart requires. If the data does not meet the minimum requirements based on the type of chart that you are using, an error will be generated.
Treemap charts supports a DataTable and a TreeMapSeries object as data sources.
The following is a list of data requirements for 2D treemap charts:
The schema contains one or more string columns.
The schema contains one or more numeric columns.
If you are binding your 2D treemap chart to a TreeMapSeries object, see Bind a Treemap Chart to a TreeMapSeries object.
The treemap chart renders data using the following rules:
Using a DataTable as a data source:
Each DataRow represents a node in the chart.
When using a DataTable as your data source, the default behavior is that each string column is used as a category name.
The IndexOrder property determines if the chart should color nodes based on data values.
The ColorValueIndex property is the index of the DataColumn which contains numeric values. This property is used to set the colors of the leaf nodes in the treemap chart. If you do not set the ColorValueIndex, it defaults to the first numeric column in your DataTable. The ColorValueIndex property is a zero based index. For more information on the ColorValueIndex property, see Map a Leaf Node’s Color to a Specific Column in a DataTable.
The SizeValueIndex property is the index of the DataColumn which contains numeric values. This property is used to set the size of the nodes in your treemap chart. If you do not set the SizeValueIndex, it defaults to the first numeric column in the DataTable. The SizeValueIndex property is a zero based index.
Using a TreeMapSeries object as a data source
Each TreeMapDataPoint object represents a node in the chart. For more information on using a TreeMapSeries object as a data source, see Bind a Treemap Chart to a TreeMapSeries object.
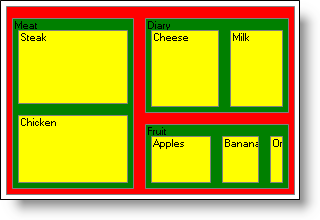
See below for an example data set, along with the rendered 2D treemap chart.