The + button on the top right-hand corner of the dashboard viewer prompts the New Visualization wizard dialog. It is meant to guide you in the process of configuring a new connection to a data source.
The first input you need to provide is what type of data source you wish to configure. For instance, suppose you’d like to create a connection to a Google Drive account. In order to do this, you would have to select the blue + button, then Google Drive. Once you do this, you are expected to log in with your Google account.
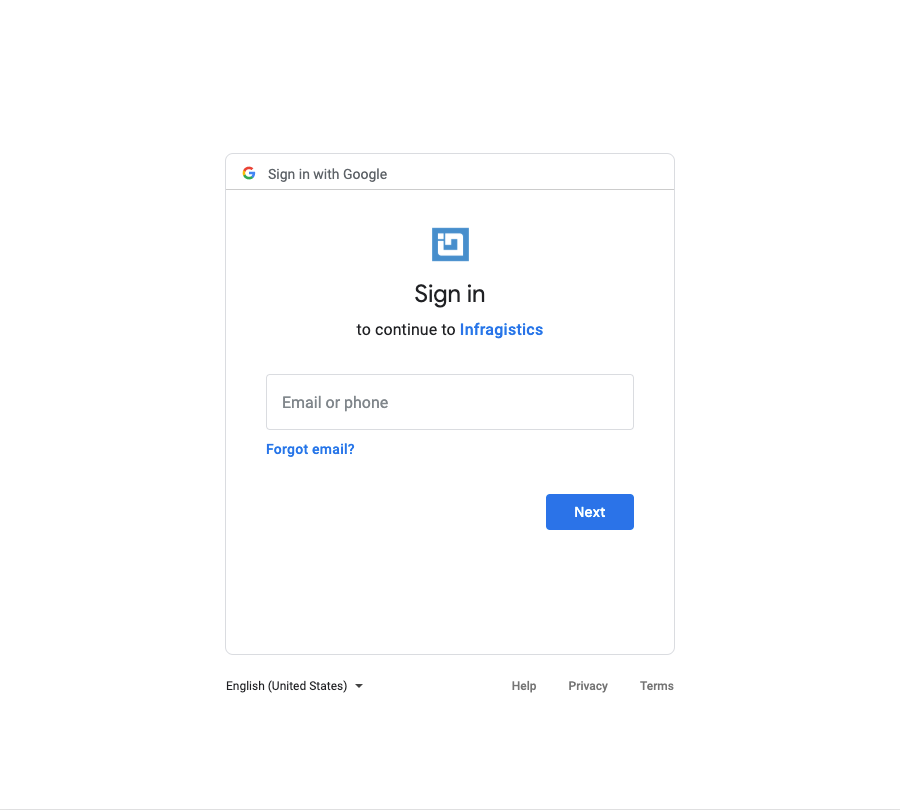
The specific login or details that you need to configure vary between the different data sources. Once you have entered all the required information, you can select Next.
In the case of SharePoint connections, you can navigate the hierarchy of sites, subsites, and lists. In the dashboard creation process, you can use files, such as Excel spreadsheets hosted in document libraries, by selecting them.

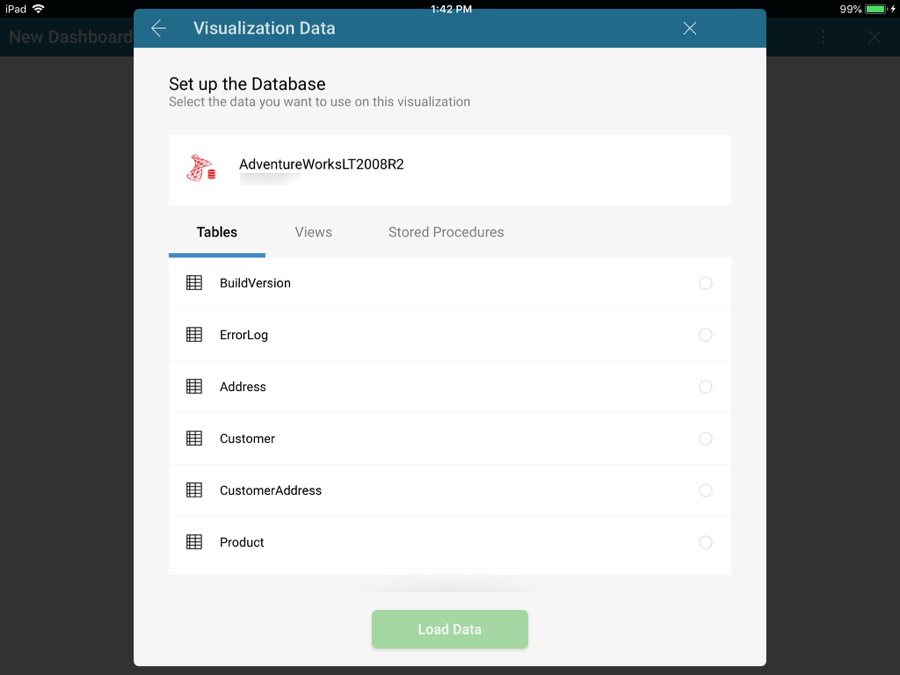
Once you select a data source, you can easily add a new dataset to the dashboard. Just select the information youw ant to use, and it will be added to the canvas automatically.
Another examples would be configure a connection to SQL Server database. In this case, you would have to navigate to the New Visualization screen and then select Microsoft SQL Server.
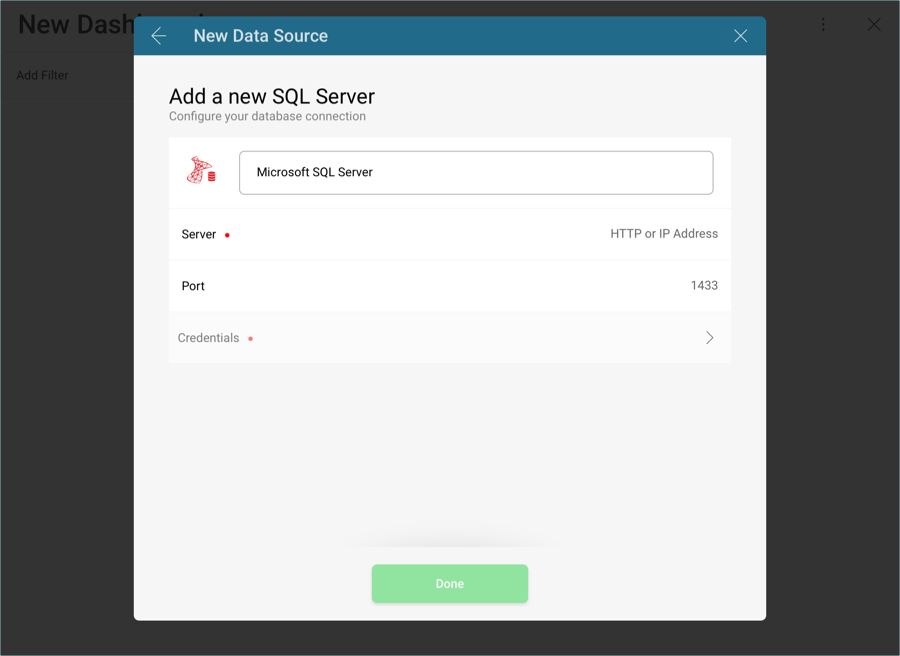
Once you save the connection, you will be able to navigate to the list of all databases in a SQL Server instance, and within a database see all tables, views and stored procedures.
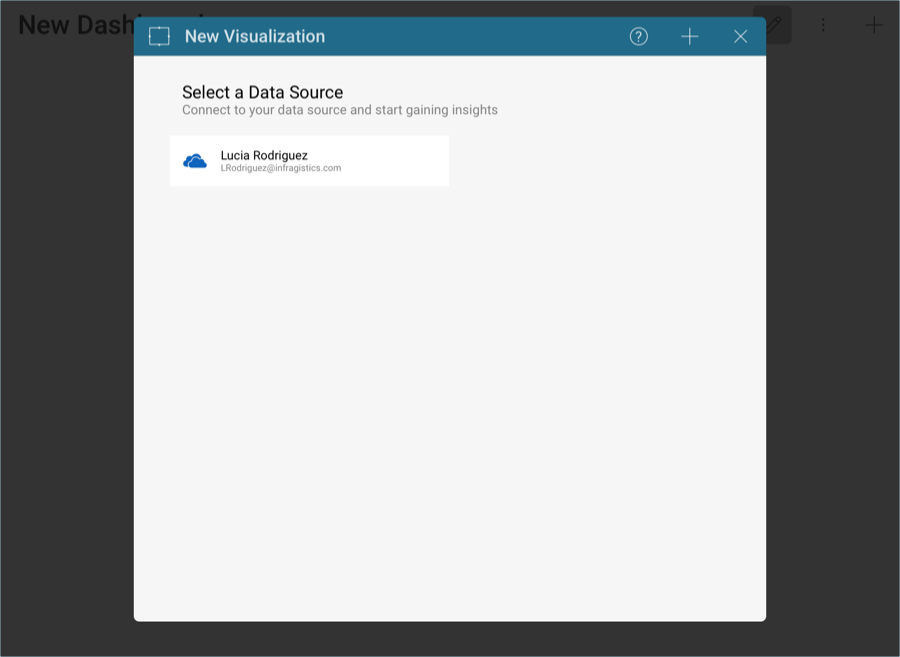
To create a dashboard using an existing Data Source, simply go to the New Visualization data wizard. If you have any data sources that have already been configured, you will see them in the Choose Data Source dialog.
