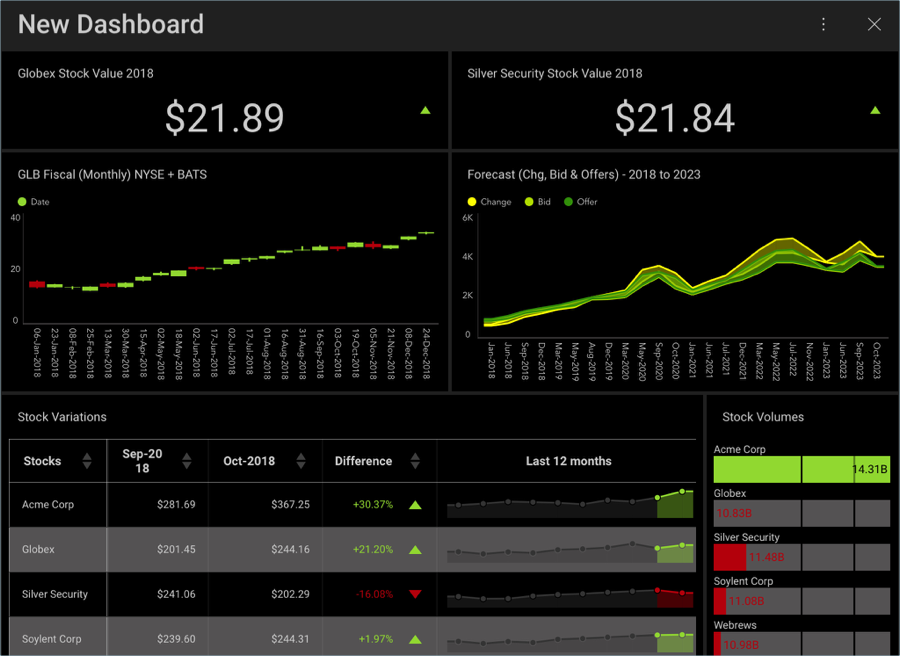
In this tutorial, you will see how the "Stock Market (Performance)" dashboard displayed below was created using a sample spreadsheet with similar data.
This dashboard contains information on a sample company’s:
The top stocks by value and the YTD value of the highest-value stock
A forecast for all changes, bids, and offers for a 4 year period
The variation in stock prices and the volume of available stocks
You can download the sample datasheet here. All other dashboards in these tutorials will use the same sample spreadsheet.