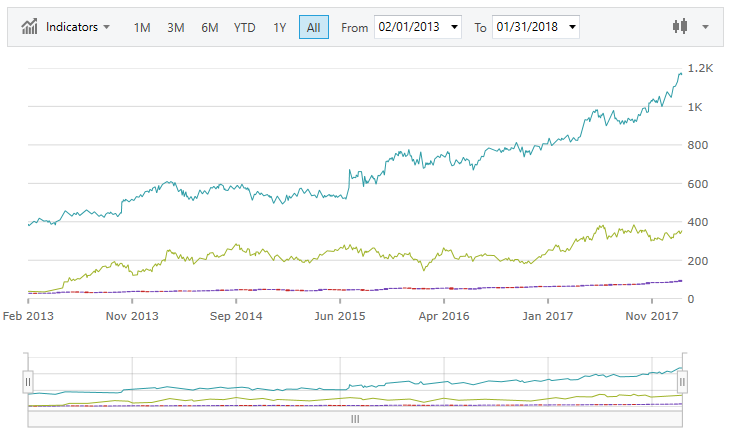
xmlns:ig="http://schemas.infragistics.com/xaml"This topic demonstrates how to bind data to the XamFinancialChart control. At the end of each section, a complete code sample is provided.
This topic contains the following sections:
The procedure below demonstrates how to bind the XamFinancialChart control to a data collection. The XamFinancialChart allows you to bind to any object that implements the IEnumerable interface. Nested collections that implement ICollection and IEnumerable are also supported.
The XamFinancialChart cannot plot multiple data sources on the XAxis in Time mode if the number of items in the data sources is not the same. The control also will not align items of multiple data sources. As a result, developers should align data items by inserting null items where one data source does not have corresponding items with another data source.
The ChartType property enables you to choose which series type you wish to display.
Supported series types:
Bar
Candle
Column
Line
Following are the general requirements for adding the XamFinancialChart control.
Add the following NuGet package reference to your application:
Infragistics.WPF.FinancialChart
For more information on setting up the NuGet feed and adding NuGet packages, you can take a look at the following documentation: NuGet Feeds.
In XAML:
xmlns:ig="http://schemas.infragistics.com/xaml"In C#:
using Infragistics.Controls.Charts;In VB:
Imports Infragistics.Controls.ChartsThe XamFinancialChart control as implemented by the binding to data sample code:

Defining a Data Model
Adding an Instance of the XamFinancialChart control
(Optional) Verifying the result
Define Data
Create a class to model the data:
In C#:
public MainWindow()
{
    InitializeComponent();
    Data data = new Data();
    List<List<Price>> multiData = new List<List<Price>>();
    multiData.Add(data.AMZN);
    multiData.Add(data.GOOG);
    this.DataContext = multiData;
}

public class Price
{
    public DateTime Time { get; set; }
    public double Open { get; set; }
    public double High { get; set; }
    public double Low { get; set; }
    public double Close { get; set; }
    public double Volume { get; set; }
    public string Label { get { return this.Time.ToShortDateString(); } }
}
In Visual Basic:
    Class MainWindow

        Private Sub Window_Loaded(sender As Object, e As RoutedEventArgs)
            Dim data As Data = New Data
            Dim multiData As List(Of List(Of Price)) = New List(Of List(Of Price))
            multiData.Add(data.AMZN)
            multiData.Add(data.GOOG)
            Me.DataContext = multiData
        End Sub
    End Class

    Public Class Price
        Private _time As DateTime
        Public Property Time() As DateTime
            Get
                Return _time
            End Get
            Set(ByVal value As DateTime)
                _time = value
            End Set
        End Property

        Private _open As Double
        Public Property Open As Double
            Get
                Return _open
            End Get
            Set(ByVal value As Double)
                _open = value
            End Set
        End Property

        Private _high As Double
        Public Property High As Double
            Get
                Return _high
            End Get
            Set(ByVal value As Double)
                _high = value
            End Set
        End Property

        Private _low As Double
        Public Property Low As Double
            Get
                Return _low
            End Get
            Set(ByVal value As Double)
                _low = value
            End Set
        End Property

        Private _close As Double
        Public Property Close As Double
            Get
                Return _close
            End Get
            Set(ByVal value As Double)
                _close = value
            End Set
        End Property

        Private _volume As Double
        Public Property Volume As Double
            Get
                Return _volume
            End Get
            Set(ByVal value As Double)
                _volume = value
            End Set
        End Property

        Public ReadOnly Property Label As String
            Get
                Return Me.Time.ToShortDateString()
            End Get
        End Property
    End Class
Add an instance of the XamFinancialChart Control
Add an instance of the XamFinancialChart and bind it to the data:
In XAML:
<Window.DataContext>
    <local:MultiData />
</Window.DataContext>
<Grid>
    <ig:XamFinancialChart ItemsSource="{Binding}" />
</Grid>
(Optional) Verify the Result
Run your application to verify the result. If you have successfully bound the XamFinancialChart control to the data collection, the resulting chart will look like the one shown above.
The following topics provide additional information related to this topic: