
Demonstrates how to configure the XamPieChart™ control for displaying OLAP data.
Prerequisite materials required to understand this topic.
This topic contains the following sections:
Visualizing OLAP data with XamPieChart is done through a new axis type called OlapAxis.
OlapAxis consists of two key properties DataSource and OlapAxisSource.
DataSoure is used for data binding, and OlapAxisSource is used for determining the axis type in data rendering. It is important to set up both of these properties in order to visualize the OLAP data with a pie chart.
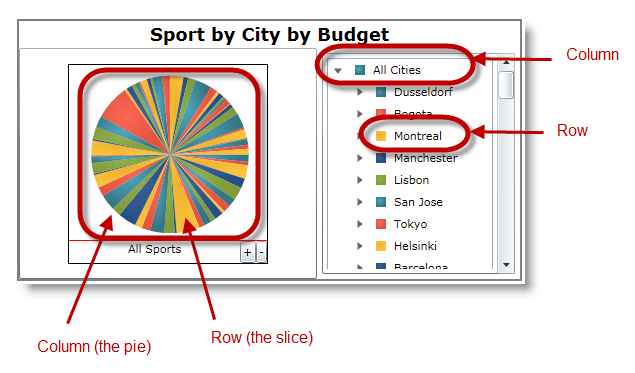
The axis type can be either Columns or Rows , referring to the columns or rows from the data source.
Each column in the data source is rendered as an individual pie chart whose rows are represented by the slices; as illustrated below.
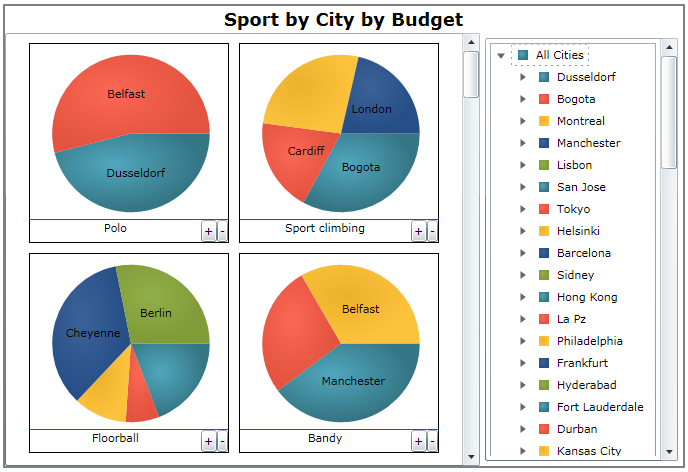
The XamPieChart control renders data containing multiple columns as multiple pie charts, one for each column from the data source. As with the previous example, the column’s rows are rendered as the slices in the correspond pies. This behavior is illustrated in the following screen shot.
By default the pie chart displays one column dimension with one row dimension, meaning one pie chart. The columns and rows are not expanded.
For more details, refer to User Interactions with OLAP Data.
The minimum required property settings for displaying a pie chart with OLAP data.
This coding example demonstrates the minimum XamPieChart control’s property settings required to display OLAP data.
In XAML:
<ig:XamOlapPieChart
    DataSource="{Binding DataSource}"
    OlapAxisSource="Columns" />
In C#:
XamOlapPieChart chart = new XamOlapPieChart();
chart.DataSource = new MainViewModel().DataSource;
chart.OlapAxisSource = OlapAxisSource.Columns;
In Visual Basic:
Dim chart As New XamOlapPieChart()
chart.DataSource = New MainViewModel().DataSource
chart.OlapAxisSource = OlapAxisSource.ColumnsThe following topics provide additional information related to this topic.