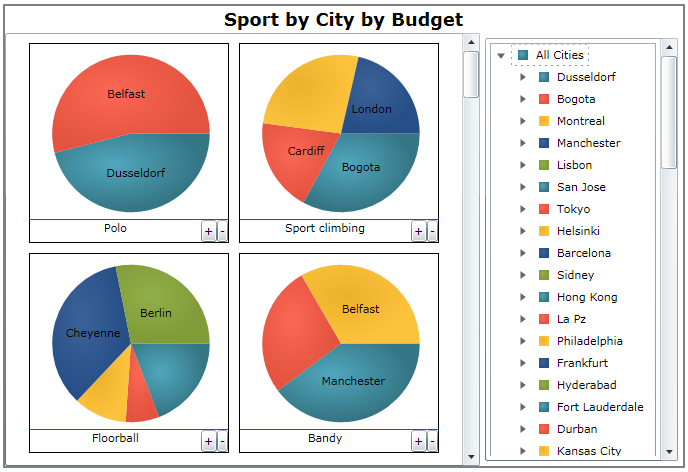

This section explains the specifics of using the XamPieChart™ control with OLAP data. The multiple pie charts in the layout indicate the columns while the pie slices are the rows of data that contain values.
Refer to the following topics for more detailed information on Visualizing OLAP Data: