Version 24.2 (latest)

Shape Chart Types

Overview

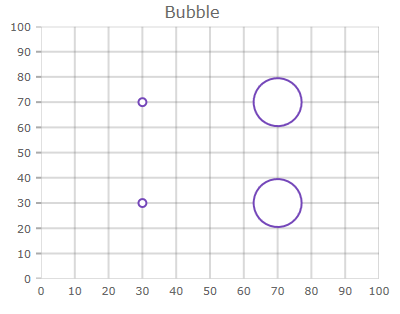
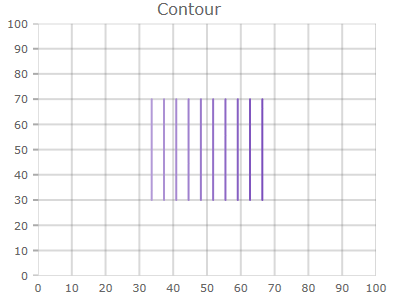
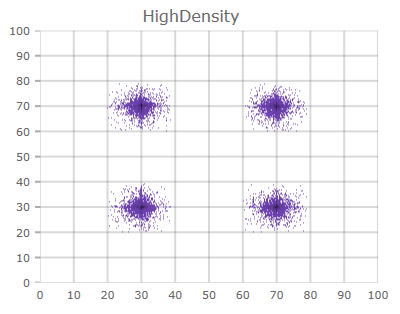
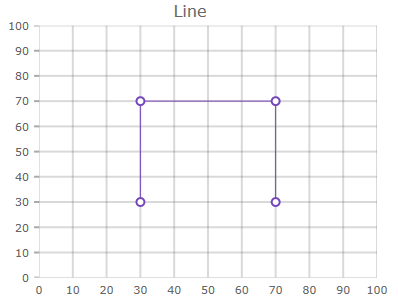
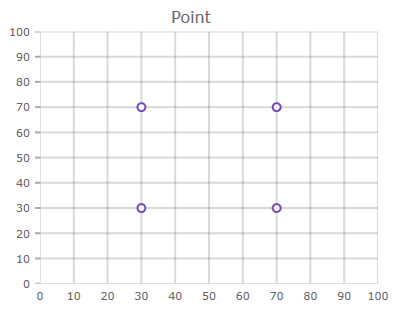
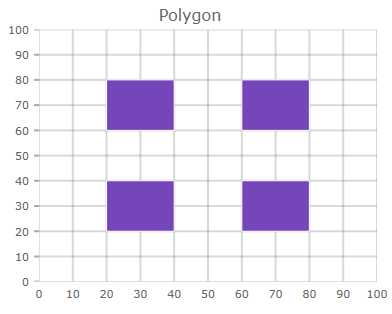
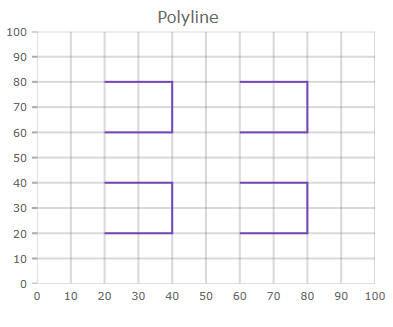
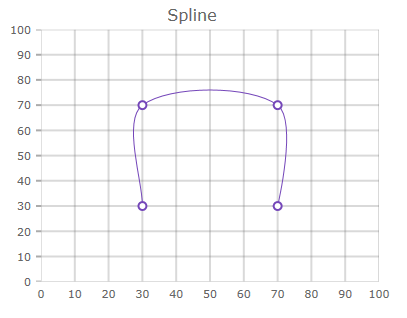
In order to select how data should be displayed it is enough to set the ChartType property of this chart. Below are all of the types that the Shape Chart supports.

Special case is the Auto setting of that property. If Auto is used the chart will analyze assigned data and will assign the most suitable chart type.

The default value of that property is determined by the size of the underlying ItemsSource bound to the category chart.

Supported Chart Types

Property Value Description Example

Area

Specifies area chart with colored surface based on a triangulation of X/Y data with numeric values assigned to each point.

shape chart area.png

Bubble

Specifies bubble chart with proportional markers at X/Y data

shape chart bubble.png

Contour

Specifies area chart with colored lines based on a triangulation of X/Y data with numeric values assigned to each point.

shape chart contour.png

HighDensity

Specifies high density chart with colored bitmap pixels at X/Y data based on density of nearby points

shape chart highdensity.png

Line

Specifies line chart with small markers at X/Y data and connected with lines

shape chart line.png

Point

Specifies point chart with small markers at X/Y data

shape chart point.png

Polygon

Specifies polygon chart with polygons defined by X/Y data

shape chart polygon.png

Polyline

Specifies polyline chart with polylines defined by X/Y data

shape chart polyline.png

Spline

Specifies spline chart with small markers at X/Y data and connected with splines

shape chart spline.png

Auto

Specifies automatic selection of chart type based on suggestion from internal Data Adapter.