The following code snippet shows how to use the built-in axis scalers to scale data values plotted in the XamShapeChart control:
<ig:XamShapeChart x:Name="shapeChart"
                  ItemsSource="{Binding Data}"
                  XAxisIsLogarithmic="True"
                  XAxisLogarithmBase="2"
                  YAxisIsLogarithmic="True"
                  YAxisLogarithmBase="2" />
shapeChart.XAxisIsLogarithmic = true;
shapeChart.XAxisLogarithmBase = 2;
shapeChart.YAxisIsLogarithmic = true;
shapeChart.YAxisLogarithmBase = 2;
shapeChart.XAxisIsLogarithmic = True
shapeChart.XAxisLogarithmBase = 2
shapeChart.YAxisIsLogarithmic = True
shapeChart.YAxisLogarithmBase = 2
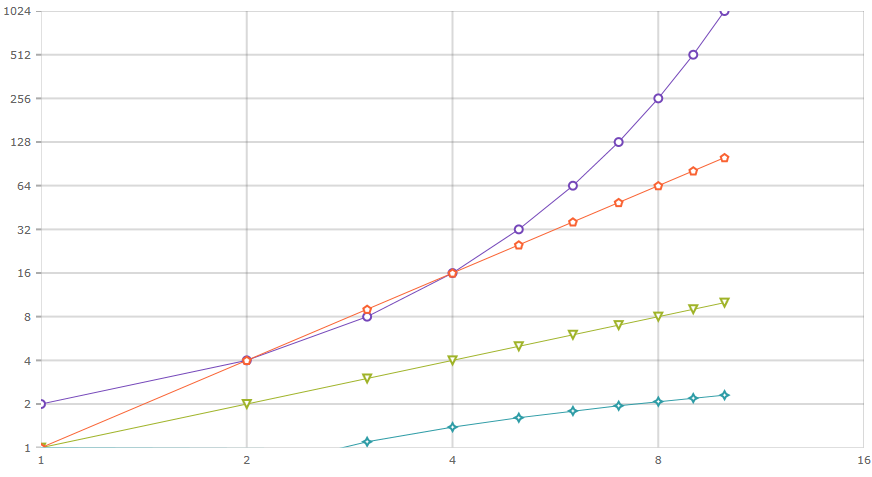
Using the above code will result in a XamShapeChart that looks like the following when using an exponential, linear, quadratic, and logarithmic set of data items: