Version

Configuring Axis Titles

Purpose

This topic provides information on configuring the x-axis and y-axis titles in the XamShapeChart control.

In this topic

This topic contains the following sections:

Property Settings

You can customize the look and feel of the XamShapeChart control’s x-axis and y-axis titles in many different ways, such as applying different font styles, margins, and alignment. This can be achieved by utilizing the following properties:

Property Name Property Type Description

string

Determines the text to be used for the x-axis and y-axis title.

enumeration

Determines the horizontal alignment of the x-axis title and the vertical alignment of the y-axis title.

double

Determines the angle rotation for the x-axis and y-axis titles.

FontFamily

Determines the font family applied to the x-axis or y-axis title.

double

Determines the font size of the x-axis or y-axis title.

FontStretch

Determines the font stretch applied to the x-axis or y-axis title.

FontStyle

Determines the font styles to be applied to the x-axis or y-axis title.

FontWeight

Determines the font weight to be applied to the x-axis or y-axis title.

Brush

Determines the color of the text for the x-axis or y-axis title.

Thickness

Determines the margin to be applied to the x-axis or y-axis title.

double

Determines the opacity of the text of the x-axis or y-axis title.

Code Snippet

The following code examples show how to customize the titles on the x-axis and y-axis in the XamShapeChart control. The code below uses the Sample Scatter Data resource.

In XAML:

<Grid x:Name="layoutRoot">
    <ig:XamShapeChart ItemsSource="{Binding}"
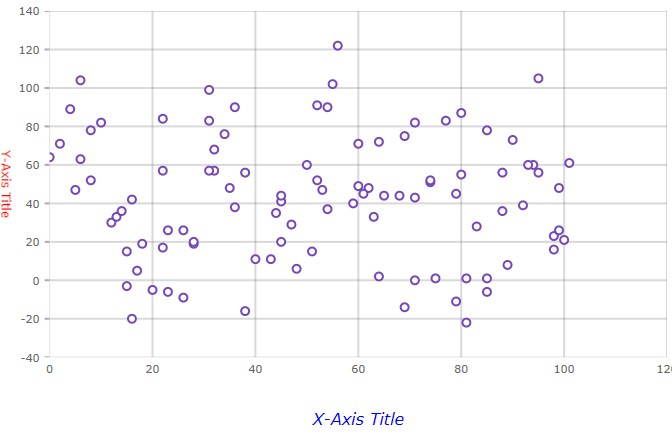
                      XAxisTitleFontSize="16"
                      XAxisTitleMargin="14"
                      XAxisTitle="X-Axis Title"
                      XAxisTitleForeground="Blue"
                      XAxisTitleFontStyle="Italic"
                      YAxisTitleFontSize="12"
                      YAxisTitle="Y-Axis Title"
                      YAxisTitleAngle="90"
                      YAxisTitleForeground="Red" />
</Grid>

In C#:

var data  = new ScatterDataSource();

var chart = new XamShapeChart();
chart.ItemsSource = data;
chart.XAxisTitleFontSize = 16;
chart.XAxisTitleMargin = new Thickness(14);
chart.XAxisTitle = "X-Axis Title";
chart.XAxisTitleForeground = Brushes.Blue;
chart.XAxisTitleFontStyle = FontStyles.Italic;
chart.YAxisTitleFontSize = 12;
chart.YAxisTitle = "Y-Axis Title";
chart.YAxisTitleAngle = 90;
chart.YAxisTitleForeground = Brushes.Red;

layoutRoot.Children.Add(chart);

In Visual Basic

Dim data = New ScatterDataSource()

Dim chart = New XamShapeChart()
chart.ItemsSource = data
chart.XAxisTitleFontSize = 16
chart.XAxisTitleMargin = New Thickness(14)
chart.XAxisTitle = "X-Axis Title"
chart.XAxisTitleForeground = Brushes.Blue
chart.XAxisTitleFontStyle = FontStyles.Italic
chart.YAxisTitleFontSize = 12
chart.YAxisTitle = "Y-Axis Title"
chart.YAxisTitleAngle = 90
chart.YAxisTitleForeground = Brushes.Red

layoutRoot.Children.Add(chart)

The above code will result in a XamShapeChart that looks like the following:

shapechart axis titles.png
Topic Description

This topic provides conceptual information about the XamShapeChart control including its main features, minimum requirements, and user functionality.

This topic explains how to bind data to the XamShapeChart control.