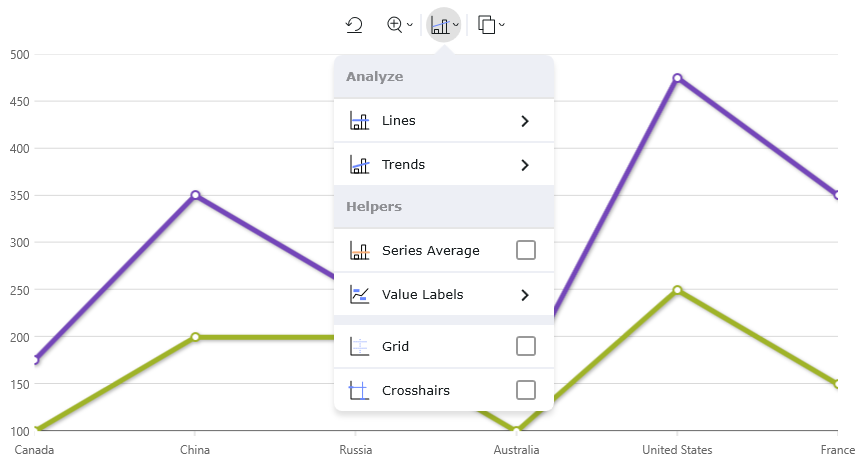
The xamToolbar component is a companion container for UI operations to interact both standalone or with the Data Chart & CategoryChart components. This allows you to easily choose from a preset of properites on the eg. XamDataChart with predefined SVG icons, but it also gives you the ability to create custom tools for your project. Benefiting from a number of attributes, you can define or change the icon in use or apply different actions to it. The Toolbar will display it’s own SVG icons.

The series in the XamDataChart now support the ability to apply a DashArray to them to visualize them as a dashed line. The dash array can also be applied to the trendlines of the series via the TrendLineDashArray property.
In addition to this, the axes support dash arrays for the axis lines and the major and minor gridlines of the axis. This is done via the StrokeDashArray, MajorStrokeDashArray, MinorStrokeDashArray properties of the axes, respectively.
The following documentation describes the various dash arrays that you can apply to the XamDataChart:
A new series type named the ValueLayer is now available which allows you to render an overlay for different focal points of the plotted data such as Maximum, Minimum, and Average. This is rendered as a dashed line in the plot area of the chart.
This series type is applied in the XamCategoryChart and the XamFinancialChart by adding to the ValueLines collection on those chart types.
The following topic reviews this new series type in more detail: