
This topic is a continuation of Creating a Complex WebGauge Using the WebGauge Designer (Part 2 of 5). This procedure guides you through the process of adding a new scale, labels, tick marks, and a range to the existing Radial gauge.
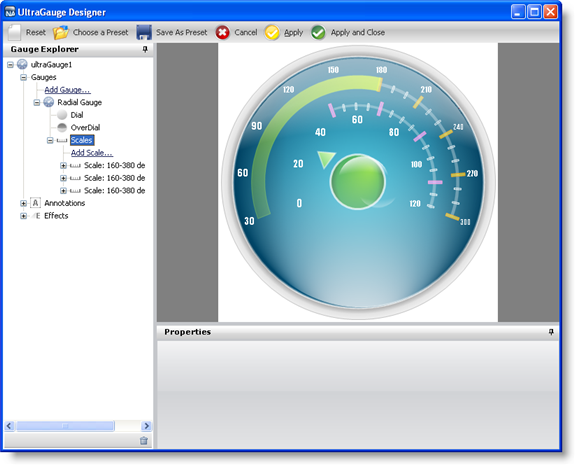
In the Gauge Explorer, expand Scales.
Click Add Scale… and select New Scale.
In the Properties panel, click the Scale Layout tab. In the Sweep Angle pane, set the following properties:
Start — 160
End — 380
In the Axis pane of the Scale Layout tab, set the following properties:
End Value — 120.00
Start Value — 0.00
Tickmark Interval — 1.0
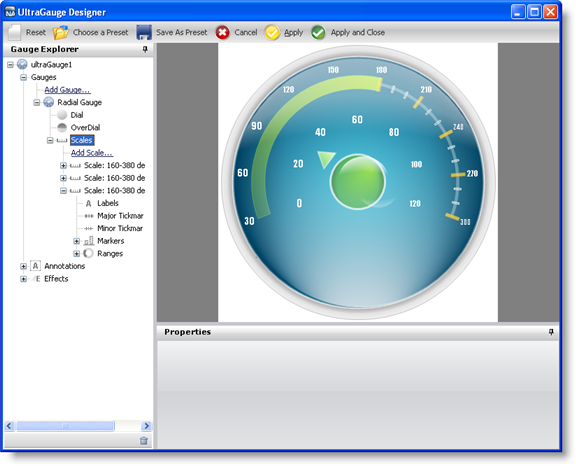
In the Gauge Explorer, expand the newly created scale, and select Labels.
In the Properties panel, click the Labels Layout tab. In the Orientation pane, set the following properties:
Extent — 45
Orientation — Horizontal
In the Formatting pane of the Labels Layout tab, set the following properties:
Frequency — 20.00
Span Max — 10
Click the Labels Appearance tab. In the Brush pane set the following properties:
Type — Solid
Color — White
In the Font pane of the Labels Appearance tab, set the following properties:
Font — Impact
Font size — 14
Type — Point
In the Gauge Explorer, select Major Tickmarks.
In the Properties panel, click the Tickmark Layout tab. In the Extent pane set the following properties:
Start — 51
End — 61
In the Widths pane of the Tickmark Layout tab, set the following properties:
Start — 4
End — 4
In the Orientation pane of the Tickmark Layout tab, set the following property:
Frequency — 20.00
Post-Initial — 49
Click the Appearance tab. In the Brush pane, set the following properties:
Type — Solid
Color — Color.FromArgb(180, 255, 158, 255)
In the Stroke pane of the Appearance tab, set the following properties:
Type — Solid
Color — Color.FromArgb(255, 135, 215)
In the Gauge Explorer, select Minor Tickmarks.
In the Properties Panel, click the Tickmark Layout tab. In the Extent pane, set the following properties:
Start — 53
End — 58
In the Widths pane of the Tickmark Layout tab, set the following properties:
Start — 2
End — 2
In the Orientation pane of the Tickmark Layout tab, set the following properties:
Post-Initial — 49
Frequency — 5.00
Click the Appearance tab. In the Brush pane, set the following properties:
Type — Solid
Color — Color.FromArgb(0, 255, 255, 255)
In the Stroke pane of the Appearance tab, set the following properties:
Type — Solid
Color — White
In the Gauge Explorer, expand Ranges.
Click Add Range… and select New Range.
In the Value pane of the Range Layout tab, set the following properties:
Start — 50.00
End — 120.00
In the Extent pane of the Range Layout tab, set the following properties:
Inner Start — 55
Inner End — 55
Outer — 57
In the Properties panel, click the Appearance tab. In the Brush pane, set the following properties:
Type — Solid
Color — Color.FromArgb(80, 255, 255, 255)
Thickness — 1