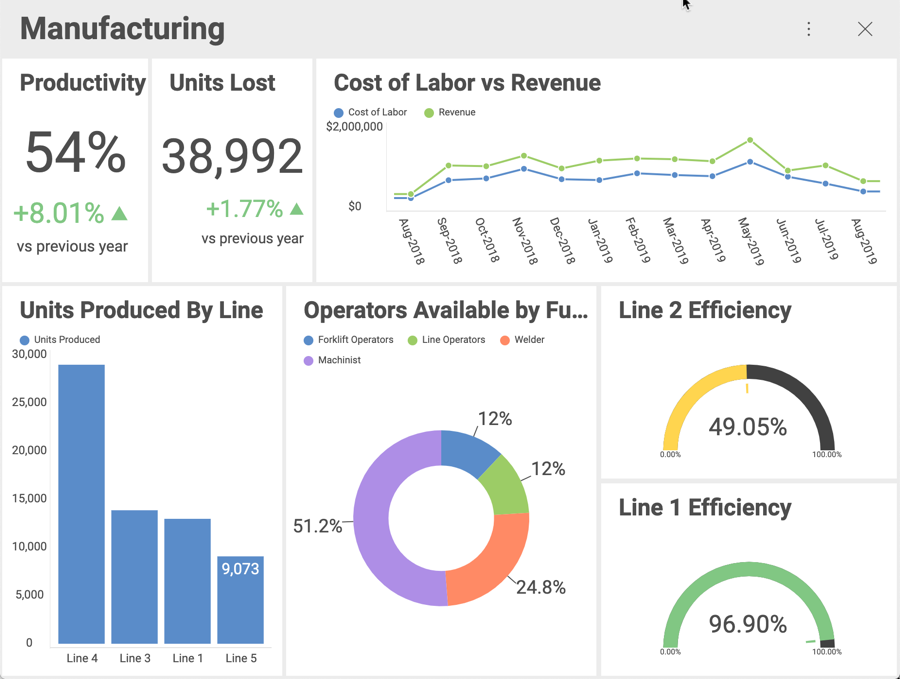
In order for users to get the most insight possible out of business data, Reveal provides several options to customize the way information is visualized.

There are several visualization types:
Gauge Views, including the Bullet Graph, Circular, KPI, Linear and Text gauges.
Several chart types, including Category, Financial, Radial, Sparkline, Scatter and Bubble, Treemap charts.
Within this section, you will find basic, step-by-step tutorials for the Reveal visualizations. All sections use the Data Visualizations data source, which you can download using this link. For specific information on what each visualization supports, visit the Data Visualizations section of the documentation.