The dashboard creation experience in Reveal includes:
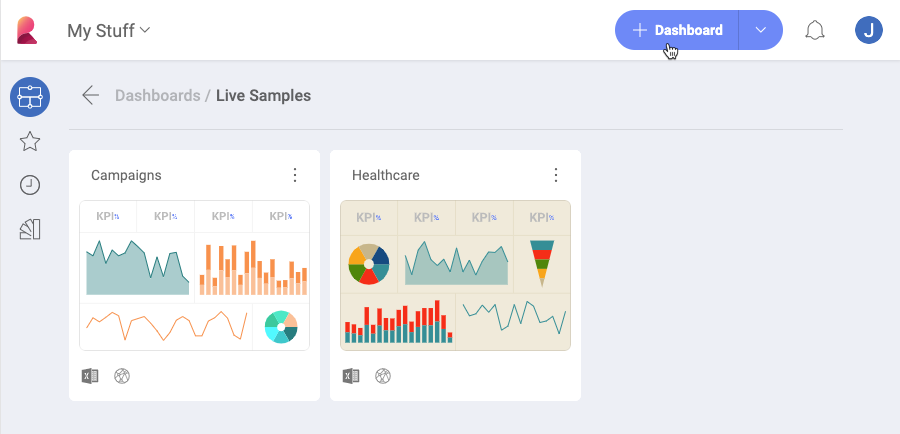
You can create a dashboard by selecting the + Dashboard split button in the initial screen.
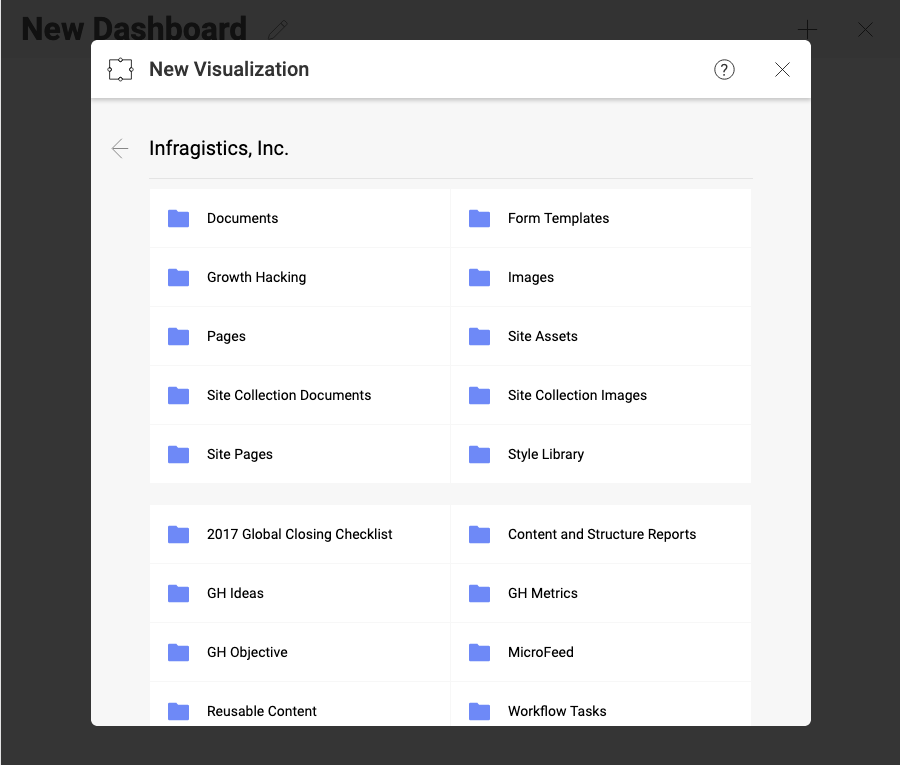
This will prompt the New Visualization dialog. In order to proceed, choose whether you want to create:
a visualization using a data source, or
a simple text box.
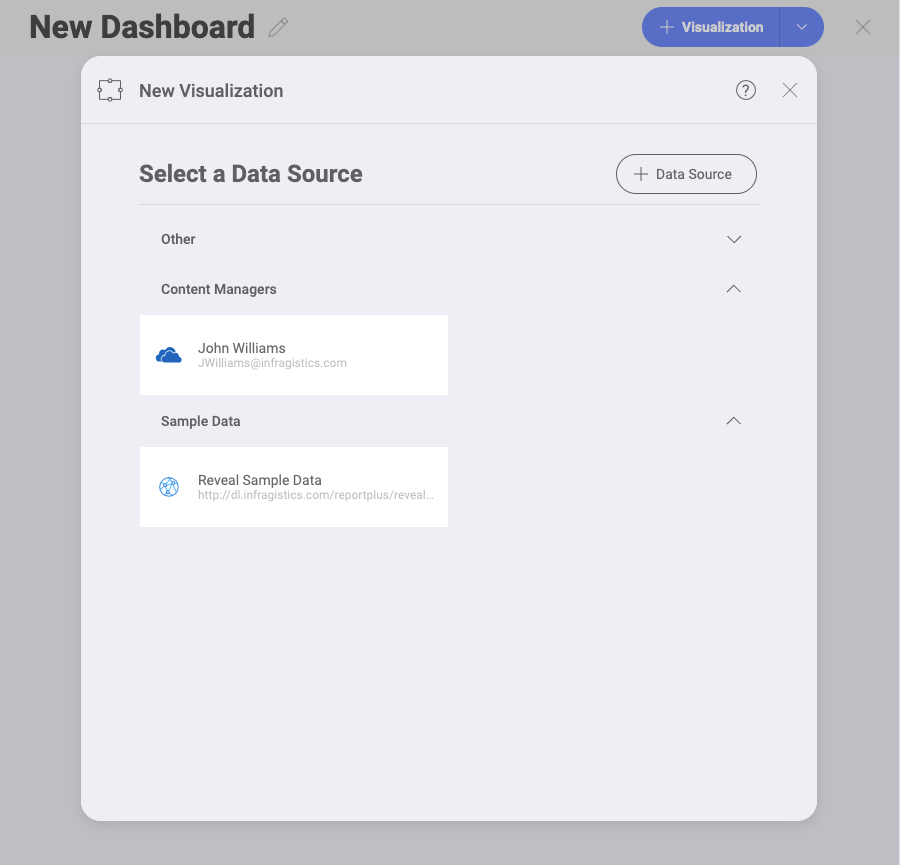
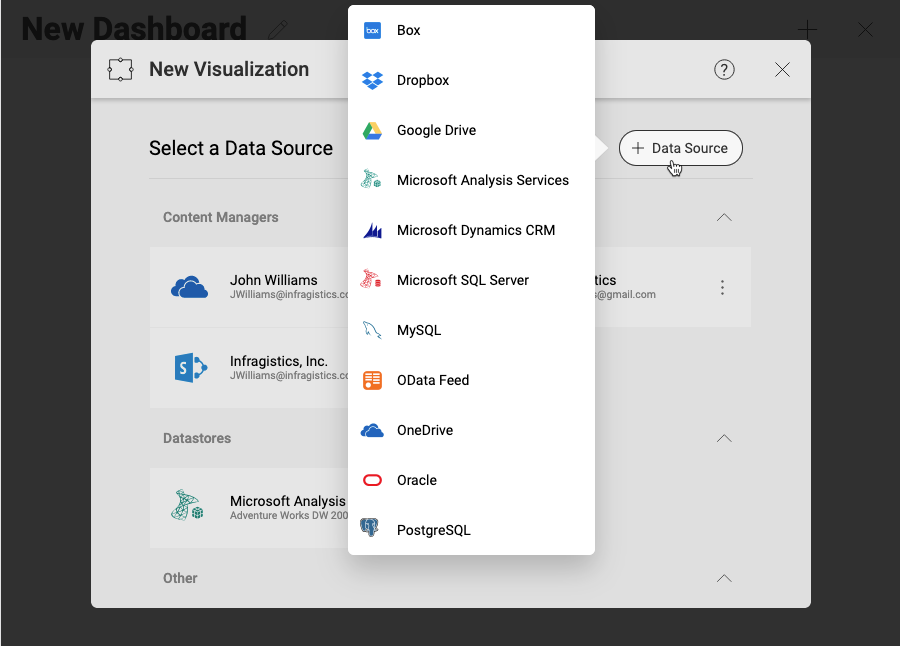
If your data source is not in the Select a Data Source section, select the + Data Source button in the top right-hand corner. A new pop-up will appear display all data source categories and the available data sources.
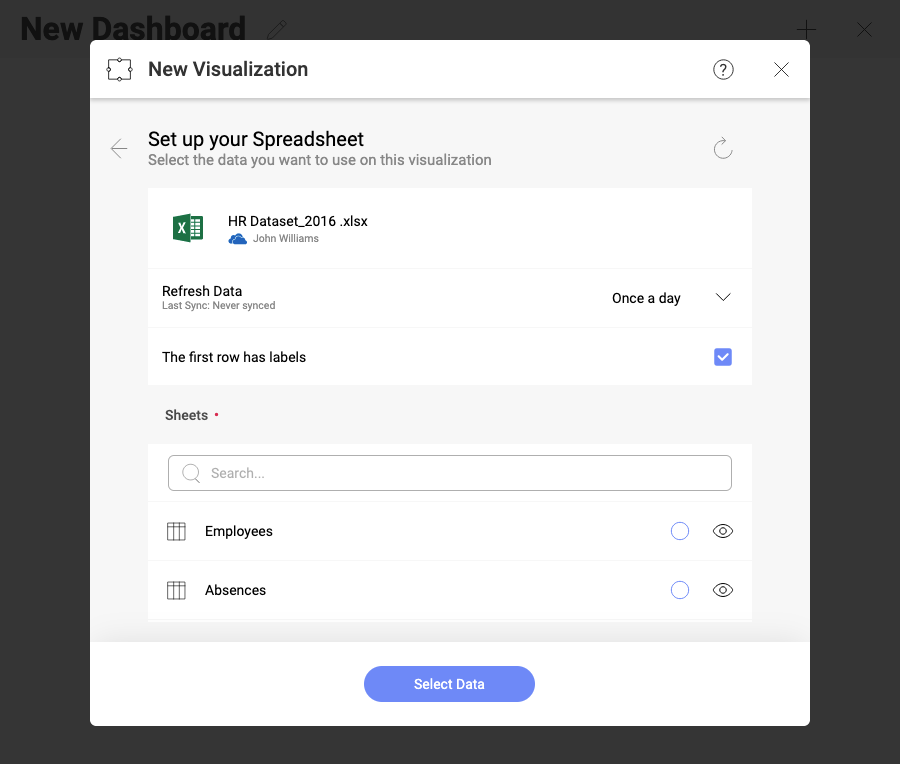
If your data source is a spreadsheet in a content manager, you will be able to select, for example, the specific sheet that you want to use in your visualization.
With Reveal, you can add many content sources, including Dropbox, OneDrive, Box and Google Drive, which will allow you to browse any folders, files or spreadsheets available in them.

In addition, you can also add SharePoint data sources, which means the ability to access any lists or libraries.
Once your data source has been added, you will be taken to the Visualizations Editor. By default, the Grid visualization will be selected.
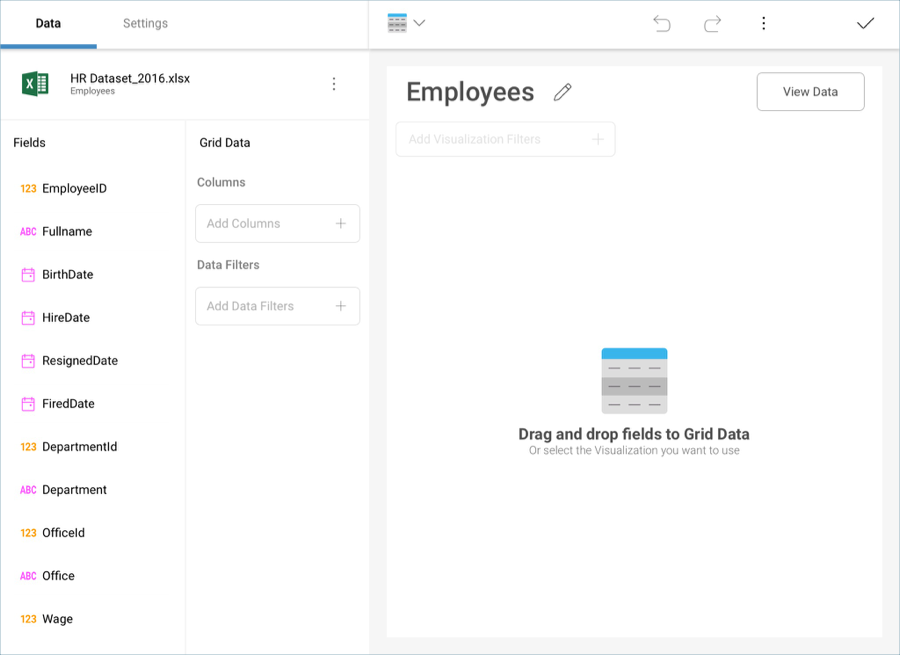
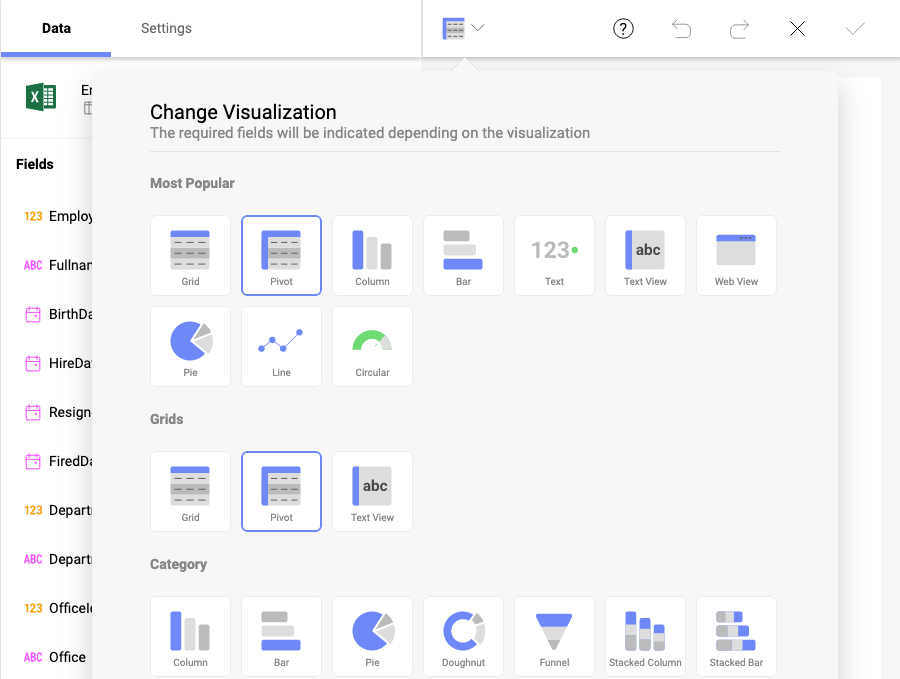
Reveal provides several options to customize the way your information is visualized; you can access the options by selecting the grid icon in the top bar.
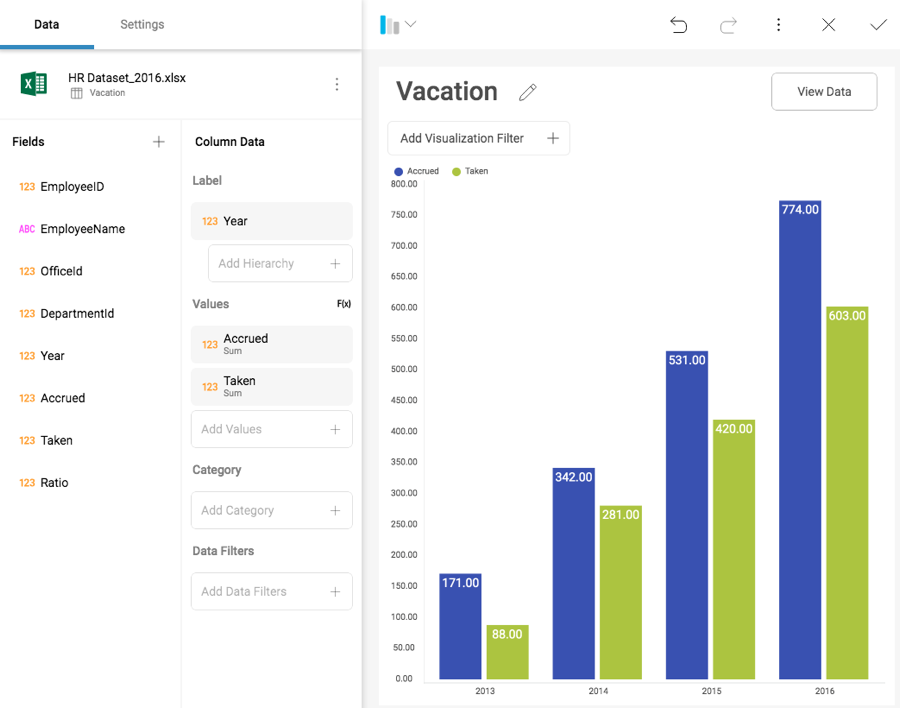
Add labels and values to your visualization and preview them in the right-hand pane. If necessary, you can change your visualization’s settings or add filters to it.
Once you have modified the visualization, you will be taken back to the Dashboard Editor. You will see Undo, Redo,Theme and Save As buttons on the top right-hand corner. You can also add any other visualizations with the + sign in the same location, or save your dashboard by selecting the tick icon.
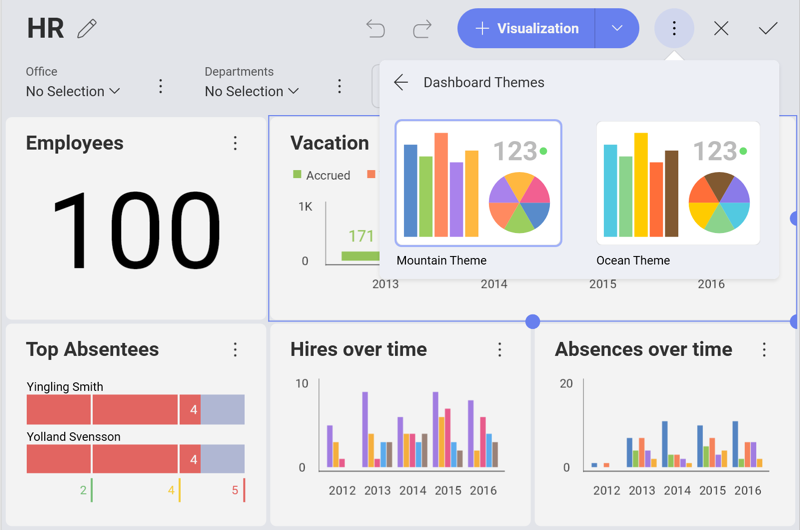
Once you have continued to your dashboard, you can select the overflow menu ⇒ Theme and switch between Mountain Theme and Ocean Theme as shown below.
Once your dashboard is ready, save it by either selecting the tick icon in the top right-hand corner or by accessing the Save As option in the overflow menu.
You can save your dashboard in your personal repository, or choose any team repositories you have joined or created. Select a name for your dashboard, and, when ready, click/tap Save here.
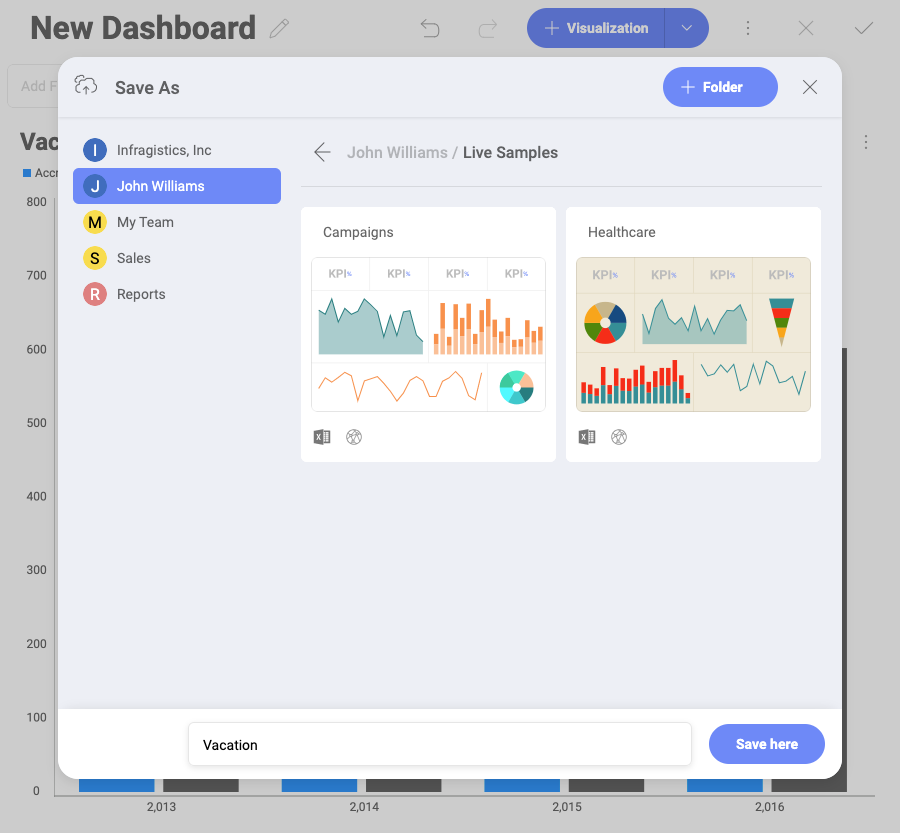
To better organize your space you can create folders in the Dashboard Viewer by clicking on the +Folder button at the top right-hand corner, while in the Save as menu.