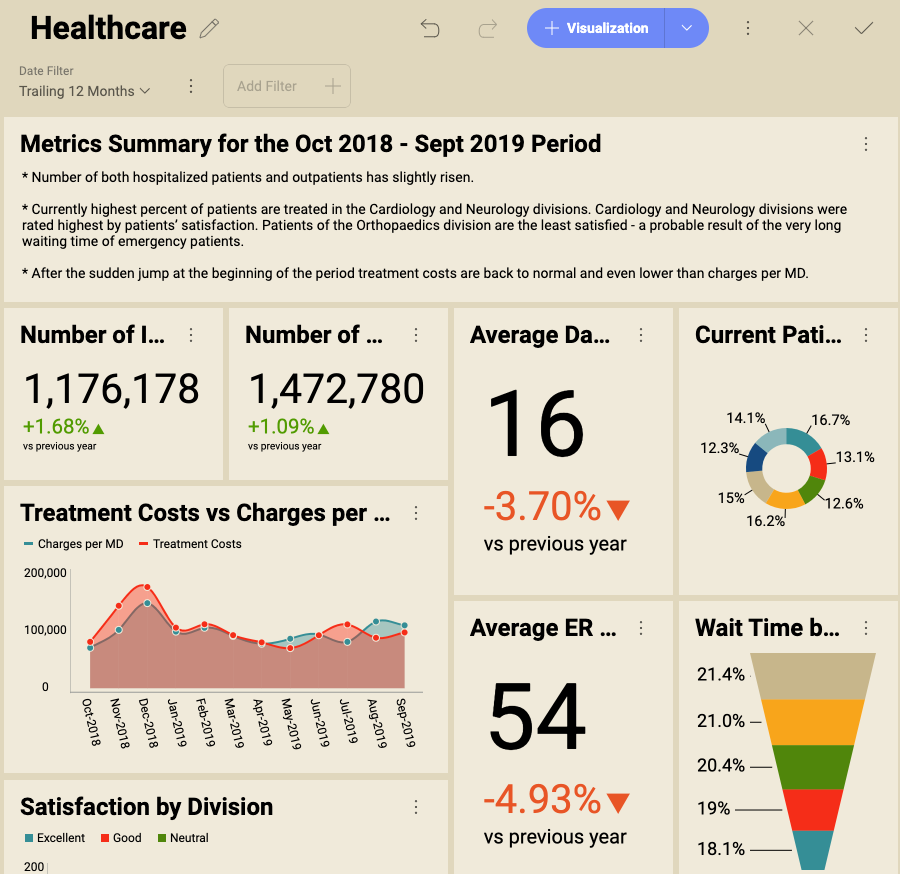
Text box visualizations, as their name suggests, consist of a text body and an optional title. They are not connected to a data source. A common scenario for using a Text box is adding a text summary to your report.
To add a Text box to an existing dashboard:
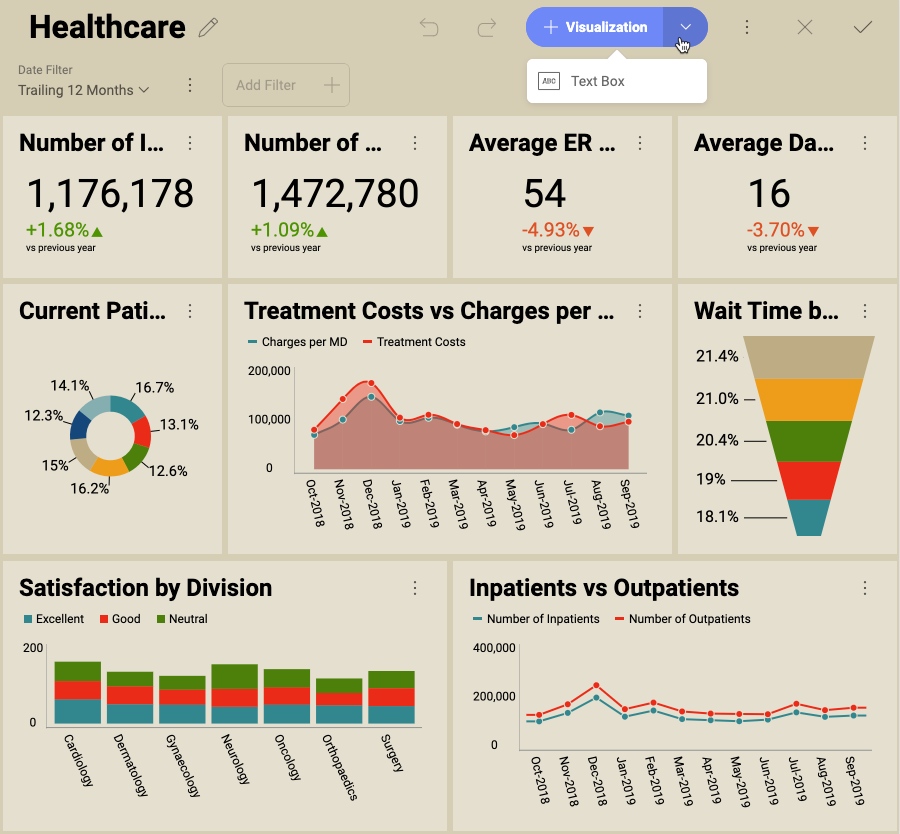
Open the dashboard in Edit mode.
Click/Tap the arrow on the right of the + Visualization split button ⇒ Text Box.
When adding a Text box visualization to an existing dashboard, it appears at the bottom of your dashboard.
Sometimes you may want to start your dashboard by creating a Text Box visualization showing a summary or brief introduction. To access the Text Box creation menu, follow the steps below:
Click/Tap the + Dashboard split button in the top right corner of Reveal’s initial screen.
The New Visualization dialog opens and prompts you to select a data source:
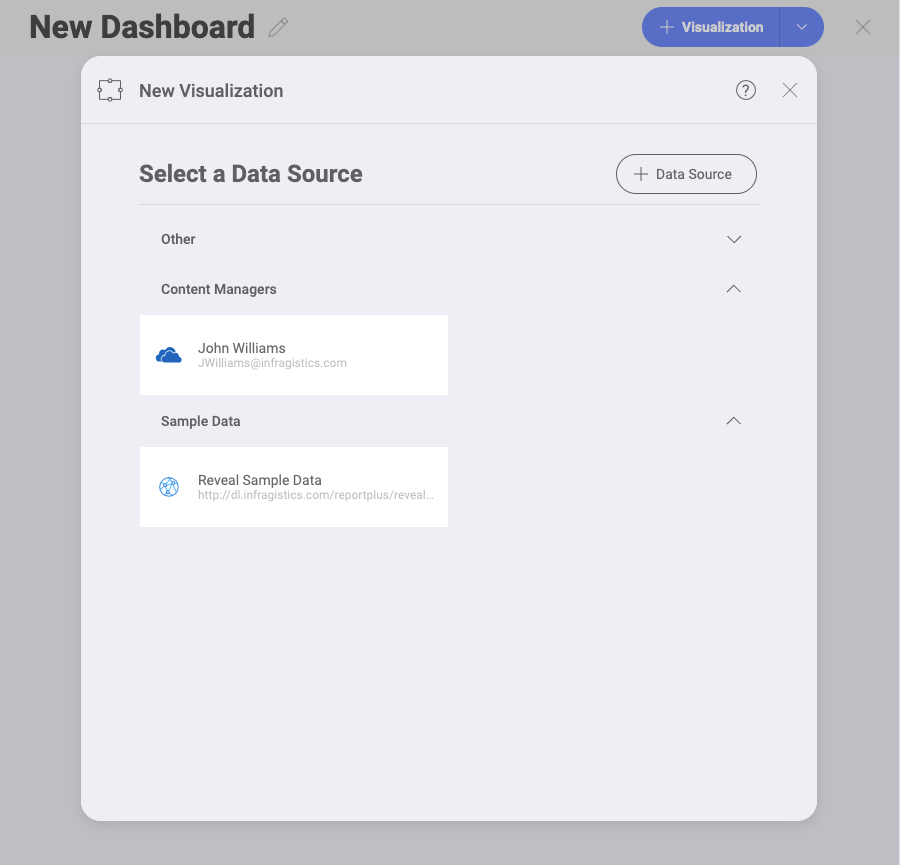
Click/Tap the X to close the dialog.
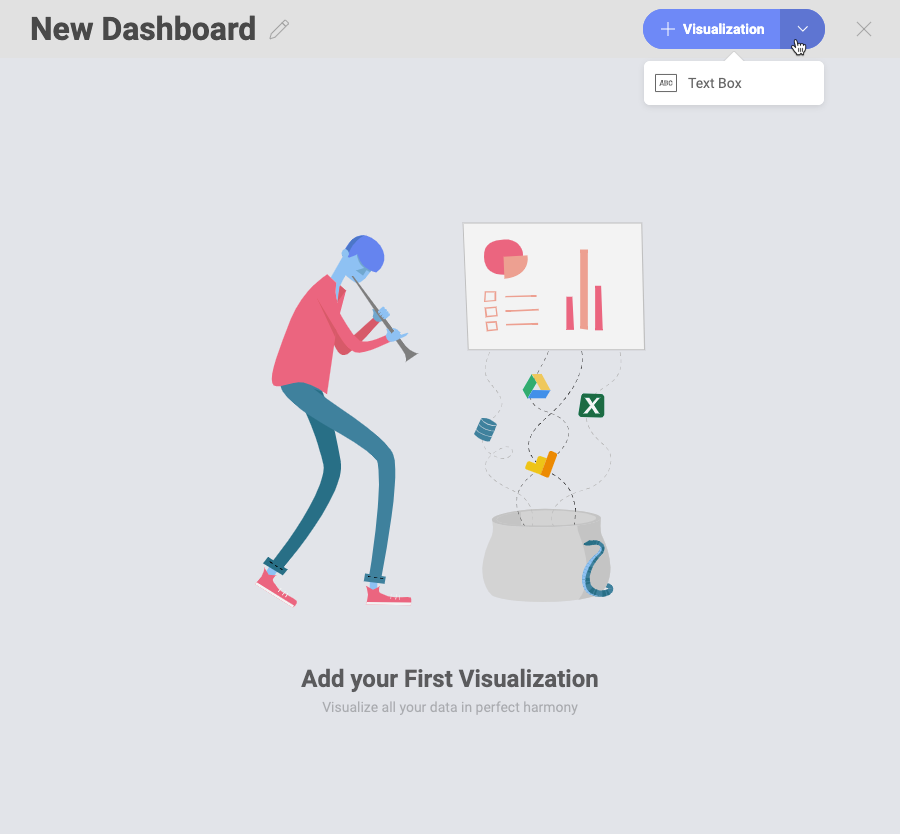
Click/Tap the arrow of the + Visualization split button ⇒ Text Box:
After choosing to add a new Text box visualization, the following empty form appears:
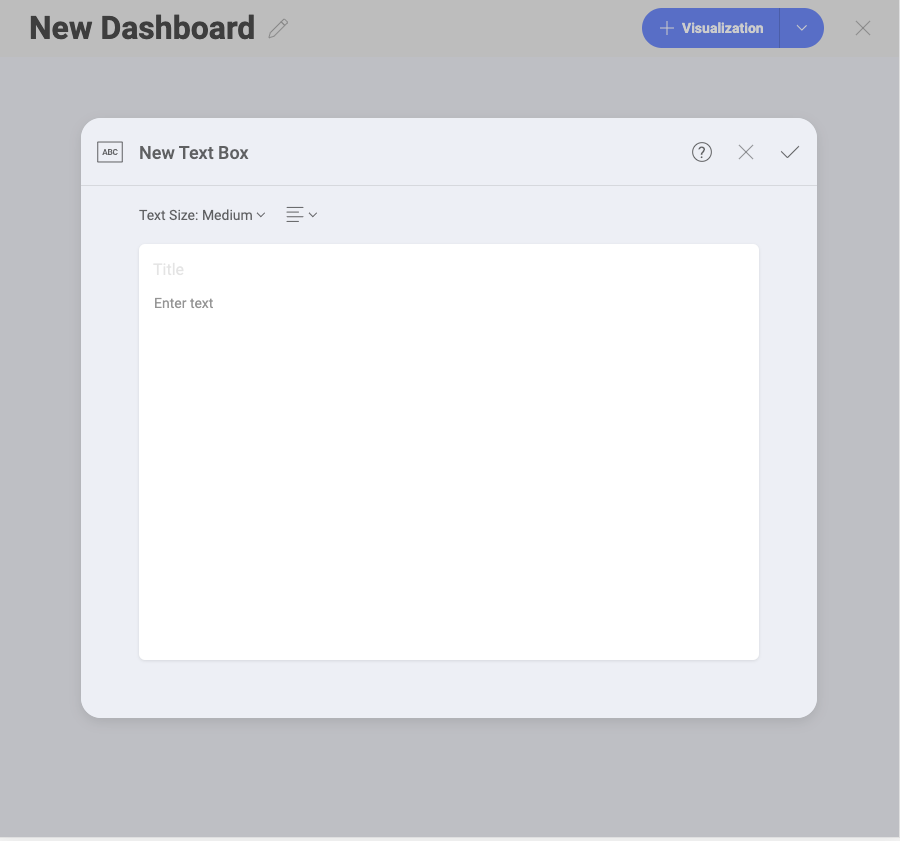
Here you can:
write your own text in the text body (the Enter text box);
(optional) add a title;
choose between Small, Medium and Large Text Size;
select the alignment of the text (next to Text Size).
Click/Tap the tick icon to save your text box.