Reveal is an affordable, true self-service BI tool, enabling you to make data-driven decisions faster. Built by user experience experts and designed for the business user, Reveal makes it simple for you to create, view and share dashboards with your teams. It offers you a seamless, identical experience no matter what device you are on: Web, Desktop, iOS, or Android.
Learn how to use Reveal with our easy, step-by-step dashboard and visualization tutorials.
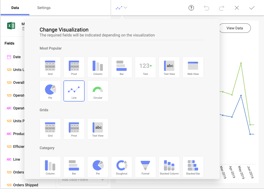
Choropleth Map visualization – Create beautiful thematic maps in Reveal with this new visualization. Present geospatial data in an incredibly digestible manner. Let color guide you and help you quickly discover patterns, trends and anomalies on the map.
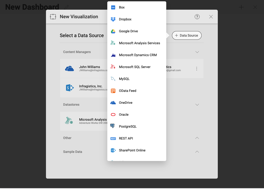
Microsoft Azure Analysis Services data source – With this new data source, you can create dashboards using your semantic data models in Azure Analysis Services.
Quickbooks data source – Now you can connect to your Quickbooks account and use your entities in Reveal.
Hubspot data source – You can now use your Hubspot objects to create dashboards in Reveal.
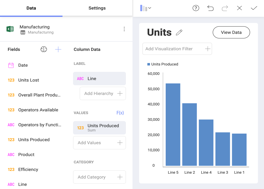
Search functionality in the Visualization Editor - When you load a dataset with more than 10 data fields in the Visualization Editor, you will have the search enabled.
Salesforce data source enhancements - Now you can use your Salesforce reports in Reveal.
PostgreSQL data source enhancements - Functions from your PostgreSQL database can now be used to create dashboards.
SharePoint data source enhancements - You can now use the metadata (name, type, etc.) collected for all files in a SharePoint library as a data source in Reveal.
Still not sure? Try our free demo version to discover what Reveal can do for your business!