Speed up the creation of dashboards by reusing visualizations; you just need to copy & paste any visualization you want.
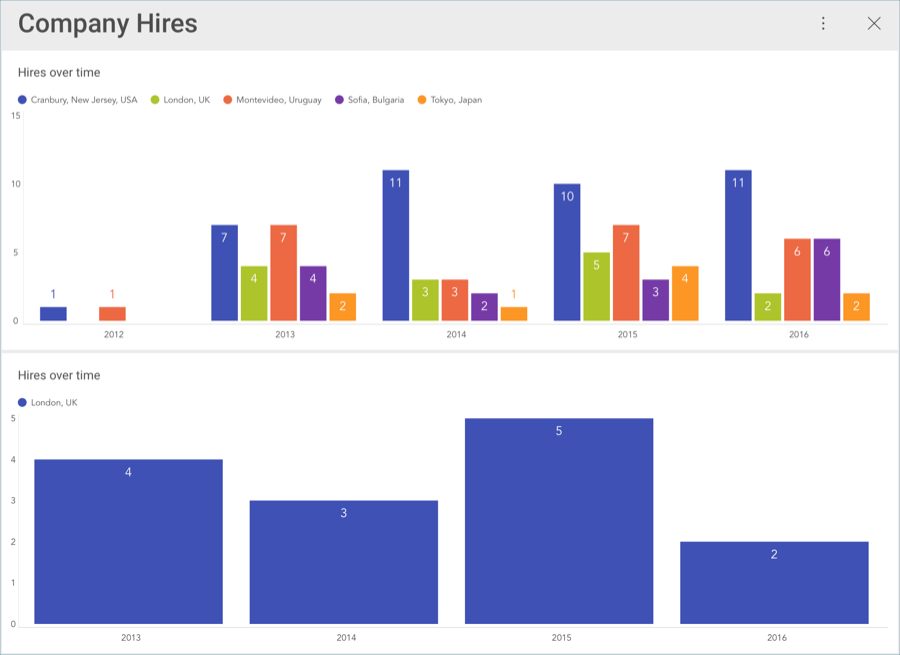
Create an exact copy of the original visualization within one dashboard. Sometimes, you need to duplicate an already customized visualization and then tweak the duplicate’s data set. For example, the charts below show Hires Over Time for all offices and a specific one separately.
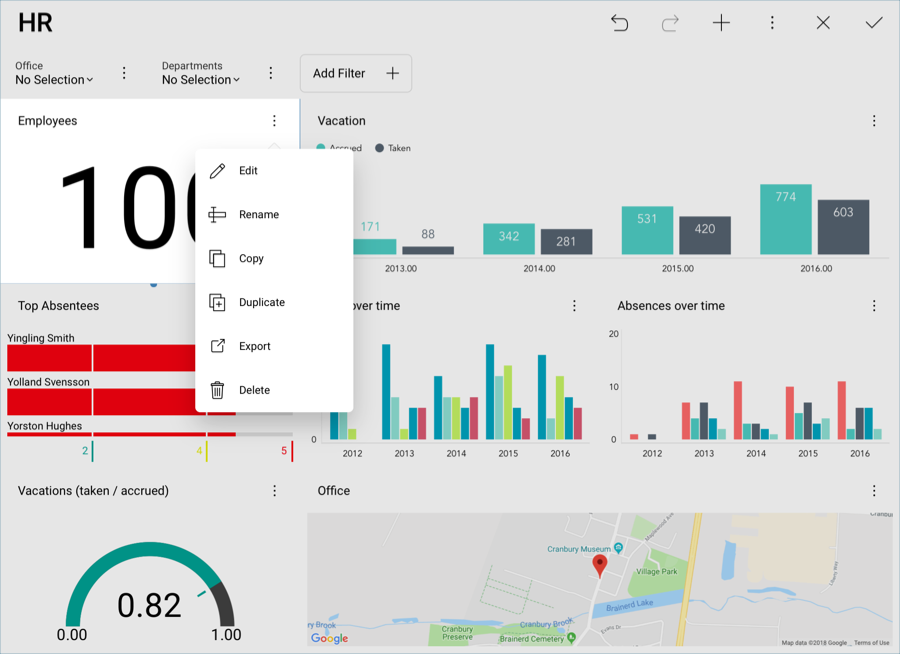
You can copy & paste any visualization within a dashboard or even across dashboards. Note that you can create new dashboards by mashing up visualizations from other dashboards.
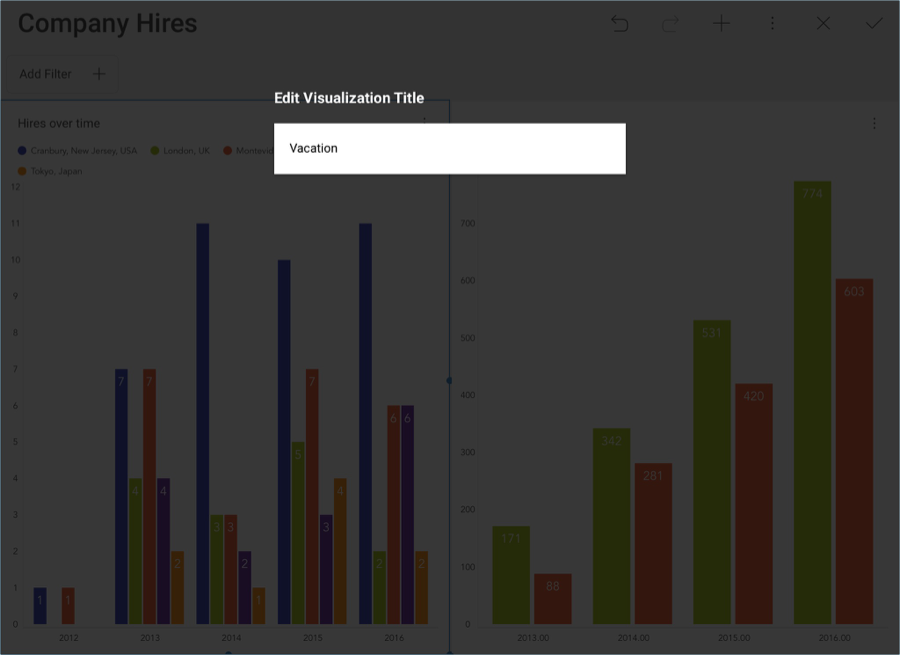
Your new visualization will have the same title as the original visualization. You can either select the title in the dashboard editor to change it, or change it from the Visualizations Editor using the pencil icon.
Also, if your original visualization had any data in the Data Editor, the new visualization will also have it. You will need to remove the fields from the Data Editor if necessary.