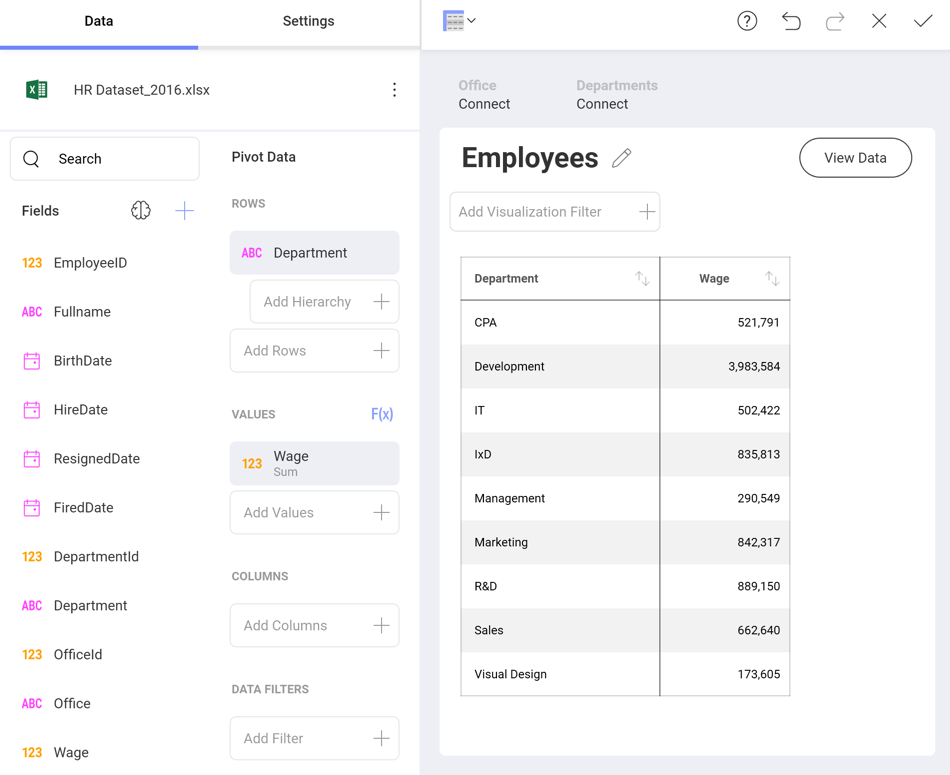
Once a dataset is selected, you will be able to enter the visualizations editor by selecting Edit from the visualization’s overflow button. This view helps you work with the data to get the most desired view; you can also select the most suitable visualization for it, making it as easy to process as possible. There are three main areas in the visualizations editor:

Data Section, where you will find the list of available fields in the selected dataset and the data editor. This tool is meant to help you slice-and-dice data according to your needs. You can use the search to find a data field, when the available fields are more than ten.
Settings Section, where you can access the settings for the specific visualization you are using and the General Settings for the visualization.
Visualizations Selector, where you can choose your desired visualization and preview the final result.
Among other things, you will be able to:
Bind the visualization data to a dashboard page selection.
Aggregate data in the data editor.
Search, Visualize & format data.
After you’re done building the visualization and selecting the appropriate visualizations, select the Back arrow to return to the Dashboard Editor. In the Dashboard Editor, you can control the layout, size, and location of the visualizations simply by dragging visualizations and their borders.