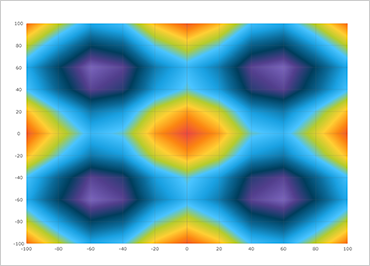
WPF Scatter Chart
The WPF Scatter Chart (available as a CTP control) is a lightweight, high-performance chart that can be easily configured to display scatter data using a simple and intuitive API. Just bind your X/Y data as a collection or a collection of collections, and the chart does the rest. Choose from Point, Bubble, Area, Contour, High Density, Line, or Spline visualizations.
Smart Data Adapter Chooses the Best Chart Type
If the ChartType property is set to Auto, the smart Data Adapter automatically chooses the best chart type for the data; for example, a bubble chart for a data set of three numeric columns, or a colored Area chart with numeric value for each pixel for a data set with 1,000+ items.
