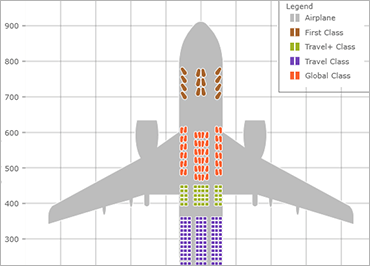
WPF Shape Chart
The WPF Shape Chart plots X/Y data, including break-even data, from shape files or any custom shape you can define. It expands the functionality of the Scatter Chart control with support for two additional data visualizations, Polyline and Polygon. The smart Data Adapter automatically chooses the right visualization for your data, or you can choose from Point, Bubble, Area, Contour, High Density, Line, Spline, Polyline, or Polygon.
