


Below are a couple of helpful tips and tricks for working with spreadsheets within Reveal.
When working with Microsoft Excel and Google Sheets, you can use the transpose functionality to switch columns from rows.
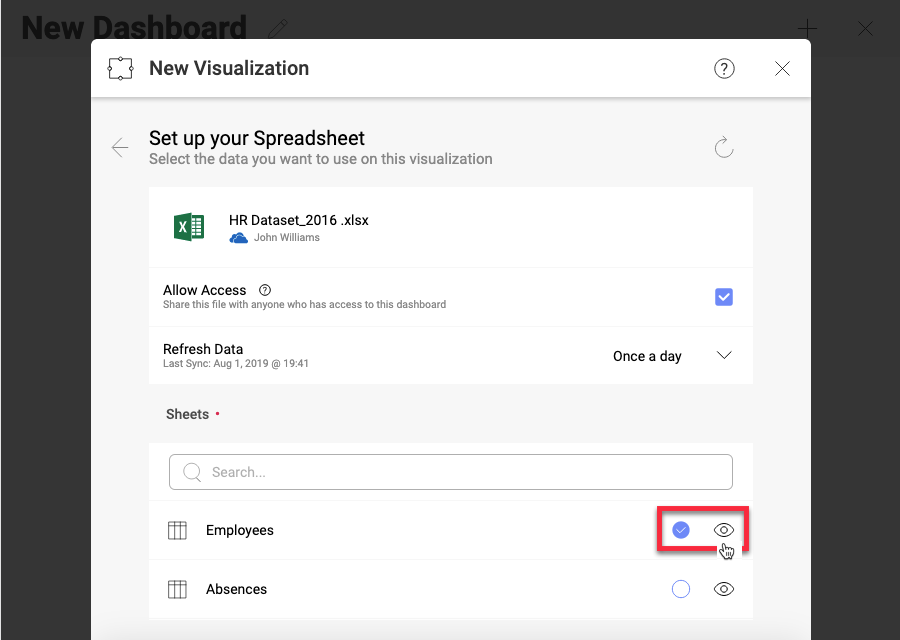
You can access the transpose menu in the Visualization Data menu when expanding the sheet in your data source.
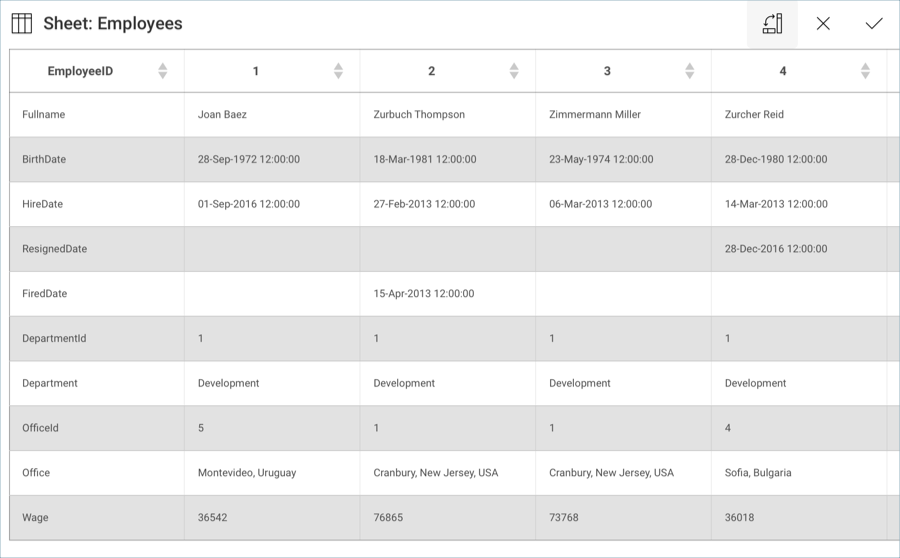
You will see a transpose icon in the top right-hand corner next to the cross button. Once you press it, Reveal will switch columns to rows and vice-versa.
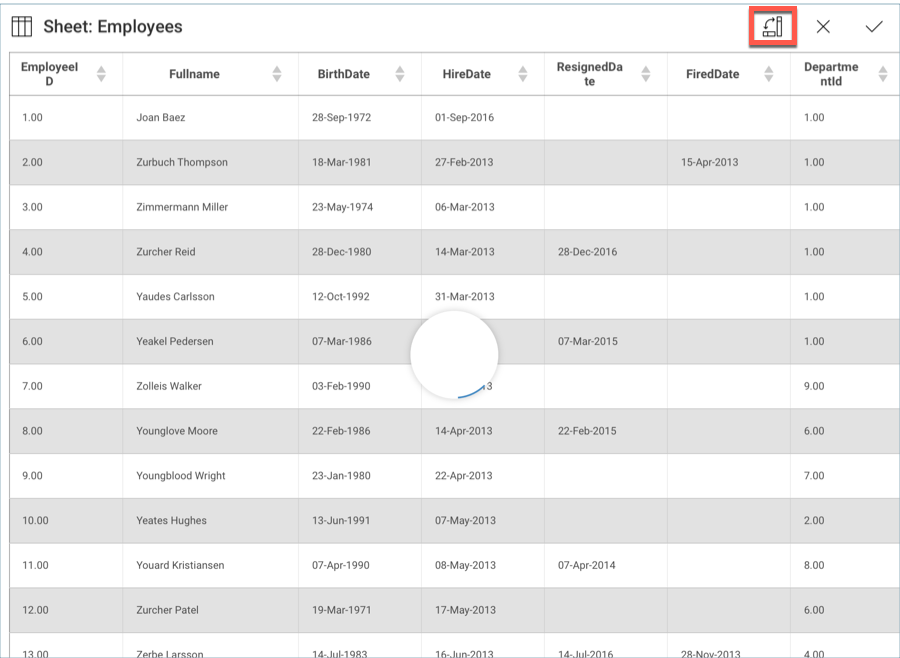
In the example above, the information in the spreadsheet will be organized in columns expressing the EmployeeID for each employee in the company.
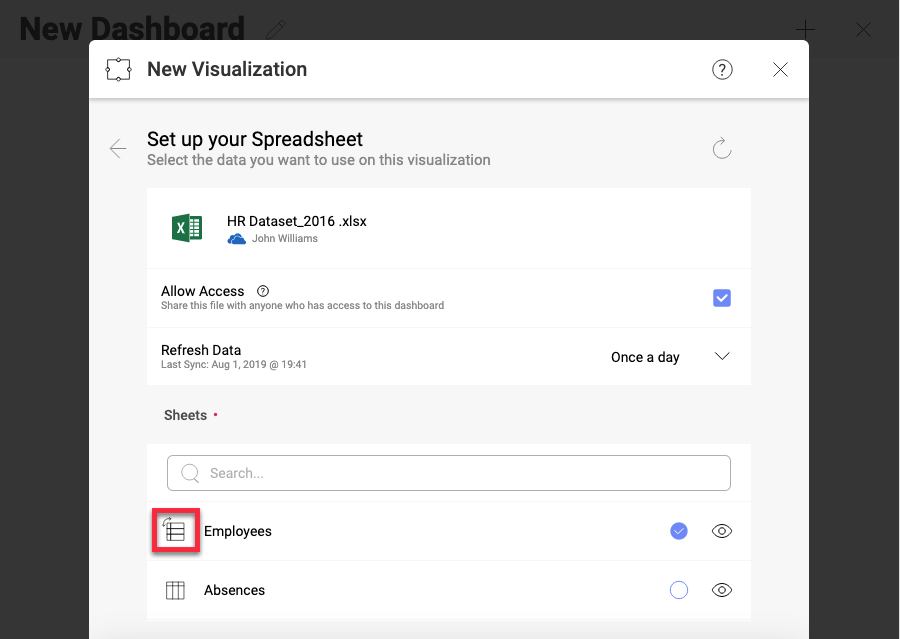
Once you are ready, select the tick icon. This will take you back to the Visualization Data menu, where you will now see the name of the sheet with a new icon to its left indicating that the sheet has been modified.
A common use case is building dashboards with spreadsheets located in a cloud file sharing service. To learn how to successfully share those dashboards with other users, please read Sharing Dashboards with Cloud Files as a Data Source.